Confirmed Buy– Signal generated on the close of January 22 (click here for more details)
today’s watchlist (potential trade entries):

Having trouble seeing the open positions graphic above? Click here to view it directly on your web browser instead.
open positions:
Below is an overview of all open positions, as well as a report on all positions that were closed only since the previous day’s newsletter. Net P/L figures are based on two separate $50,000 model portfolios (one for ETFs and one for stocks). Changes to open positions since the previous report are listed in pink shaded cells below. Be sure to read the Wagner Daily subscriber guide for important, automatic rules on trade entries and exits.

Having trouble seeing the open positions graphic above? Click here to view it directly on your web browser instead.
closed positions:
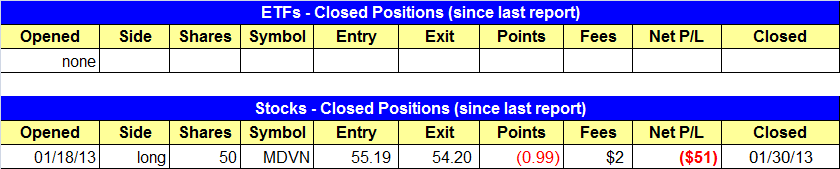
Having trouble seeing the closed positions graphic above? Click here to view it directly on your web browser instead.
ETF position notes:
- $EWS buy entry triggered.
stock position notes:
- Sold 50 shares of $MDVN for a small loss.
- We are waiving the 5-minute rule in $OCN for tomorrow on the 38.01 entry since it already triggered the day before.
ETF, stock, and broad market commentary:
After bouncing around for most of the day, stocks sold off in the final 90 minutes of trading in reaction to the Fed’s decision on rates. Losses for the most part were mild and contained to the -0.3% to -0.4% range, with only the small-cap Russell 2000 taking a hit at -1.2%. Although the market sold off, turnover eased on the NYSE, which prevented the S&P 500 from suffering a bearish distribution day. Nasdaq volume did increase by 2%, but the pick up in volume is misleading because of the huge volume in $RIMM yesterday. If we take away the 100 million shares that were traded above average in $RIMM, then Nasdaq volume would have come in about 2% lighter than Tuesday’s pace. So, despite the higher volume in the Nasdaq there is no distribution.
Our nightly scans have dried up the past few days (no setups) which is normal when a market is extended in the short-term. Ideally, we’d love to see a 2-3 day pullback on light volume in the S&P 500, or at the very least a couple days of sideways action to produce low-risk entry points.
$EWS was added to the ETF portfolio yesterday, as it triggered the buy entry on a decent pick up in volume. After further analysis, we lowered the stop in $XHB to give the trade some breathing room. We want to avoid getting stopped out on a one or two day shakeout below the rising 10-day MA, so our stop is now below the 20-day EMA, minus some wiggle room. Our stop remains tight in $RWO, due to the lack of extension from the breakout pivot.
As mentioned above, our scans have failed to produce much in the way of actionable setups the past two days. As for potential setups that might be a few weeks away from triggering, we have the iShares MSCI Indonesia ($EIDO), which is consolidating in a tight range on the weekly chart after breaking the downtrend line.

Note the tight price action over the past six months in the 30.00 to 31.00 range, and the sequence of higher swing lows since May of last year. The longer a base remains in (tight) consolidation mode, the more explosive the action should be on the eventual breakout. The problem with longer consolidations is that they may not breakout in time to participate in the current rally.
On the stock side, we stopped out of half (50 shares) of $MDVN and remain long the other half with a pretty tight stop. Although $MDVN’s price action was ugly two day’s ago, if the price action can hold above the 50-day MA and return back above 55.00, then we could see a move up to the 58.00 area, and a second attempt at a breakout.
Just a reminder that we are not using the 5-minute rule on the 38.01 entry in $OCN. If the setup triggers before 9:35 we are buying right away, do not wait for 5-minutes to pass.
One setup we are monitoring for a potential entry point within the next few weeks is $SCTY.

Although the setup is currently not actionable, if $SCTY forms a higher low and chops around for a week or two in the 14.00 to 16.00 range (above 20EMA), then we could see a low-risk entry point develop. $SCTY is a recent IPO with a solid relative strength ranking of 92.
If you are a new subscriber, please e-mail [email protected] with any questions regarding our trading strategy, money management, or how to make the most out of this report.
relative strength combo watchlist:
Our Relative Strength Combo Watchlist makes it easy for subscribers to import data into their own scanning software, such as Tradestation, Interactive Brokers, and TC2000. This list is comprised of the strongest stocks (technically and fundamentally) in the market over the past six to 12 months. The scan is updated every Sunday, and this week’s RS Combo Watchlist can be downloaded by logging in to the Members Area of our web site.