market timing model:
Confirmed Buy – Signal generated on the close of September 4 (click here for more details) (we are on a buy signal from the close of Aug. 16)
today’s watchlist (potential trade entries):

Having trouble seeing the open positions graphic above? Click here to view it directly on your web browser instead.
open positions:
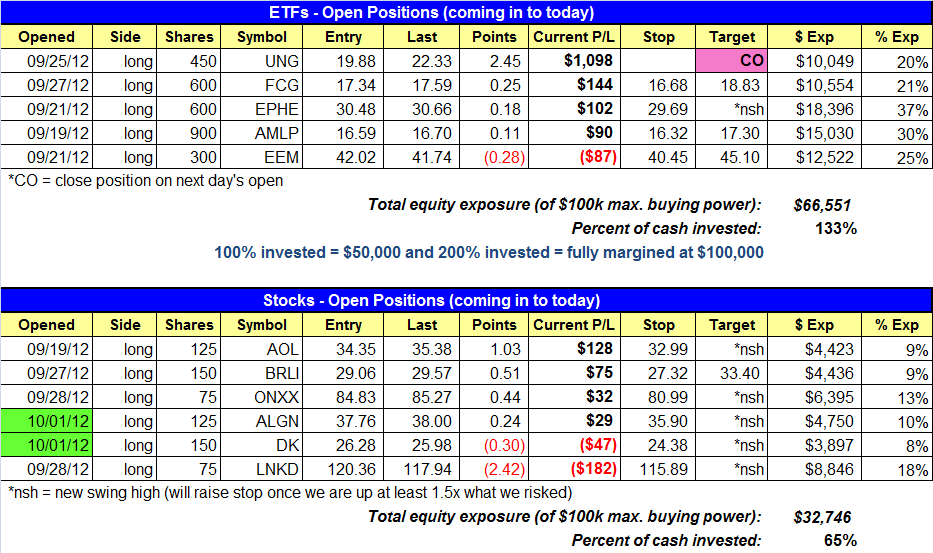
Below is an overview of all open positions, as well as a report on all positions that were closed only since the previous day’s newsletter. Net P/L figures are based on two separate $50,000 model portfolios (one for ETFs and one for stocks). Changes to open positions since the previous report are listed in pink shaded cells below. Be sure to read the Wagner Daily subscriber guide for important, automatic rules on trade entries and exits.
Having trouble seeing the open positions graphic above? Click here to view it directly on your web browser instead.
closed positions:

Having trouble seeing the closed positions graphic above? Click here to view it directly on your web browser instead.
ETF position notes:
- Selling UNG at market on the open to lock in a strong gain.
stock position notes:
- ALGN and DK buy entries triggered.
ETF and broad market commentary:
Stocks pushed higher during the first hour of trading, lifting the broad market averages above a three-day high with intraday gains as much as 1.2% (in the Dow). However, the morning momentum fizzled, as the broad based averages sold off the rest of the day, with three out of five averages closing in the lower third of the day’s range. The Dow Jones Industrial Average ($DJIA) held on to a 0.6% gain. Both the S&P 500 Index ($SPX) and small-cap Russell 2000 ($RUT) closed well off the highs of the day, up 0.3%. The Nasdaq Composite ($COMPX) and S&P MidCap 400 finished in negative territory, down 0.1% and 0.5% respectively.
Total volume was ahead of Friday’s pace for most of the session but dropped off considerably in the final hour of trading, allowing the major averages to escape a second straight day of distribution. Total volume closed 10% lower on the NYSE and 4% lower on the Nasdaq. Advancing volume finished ahead of declining volume by a 1.6 to 1 margin on the NYSE. The Nasdaq ADV/DEC volume ratio closed slightly positive at 1.2 to 1. The dry up in volume was a positive sign for the bulls in what was a negative reversal day.
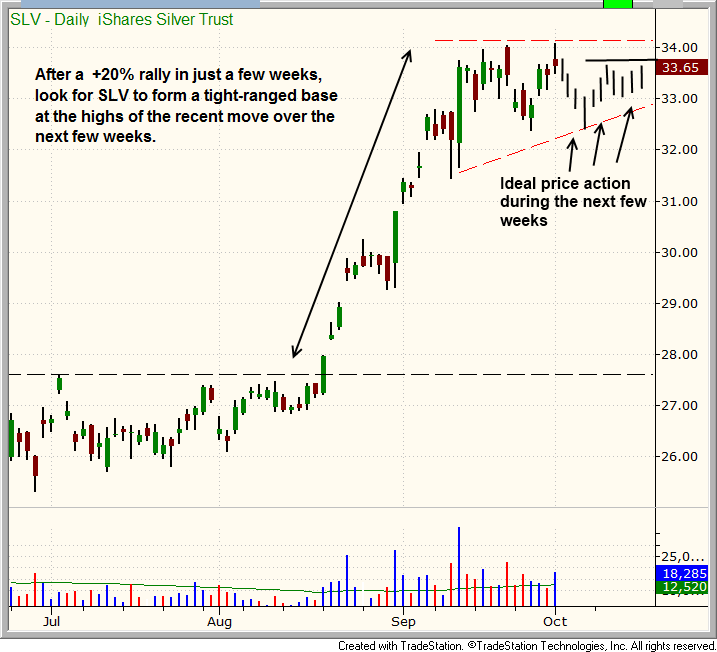
In late August, we bought a bull flag breakout in gold ($DGP), which we sold into strength for a near 10% gain on a six day hold. Along with gold, we are monitoring iShares Silver Trust ($SLV) for a potential breakout entry within the next few weeks. After a strong run up off the lows, we would welcome a tight four to six week consolidation at the highs. Ideally, we’d like to see SLV put in one or two higher swing lows while holding above 32.00.
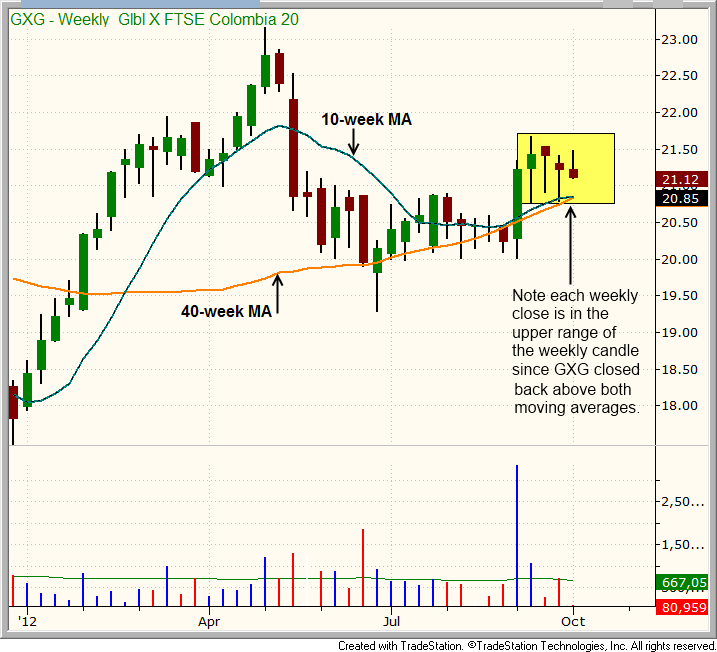
We first listed the Global X InterBolsa FTSE Colombia20 ($GXG) a few weeks ago due to the strong base of consolidation on the weekly chart. We still like the price action and the weekly chart continues to show bullish price action after breaking above the major averages in early September. Th weekly chart:
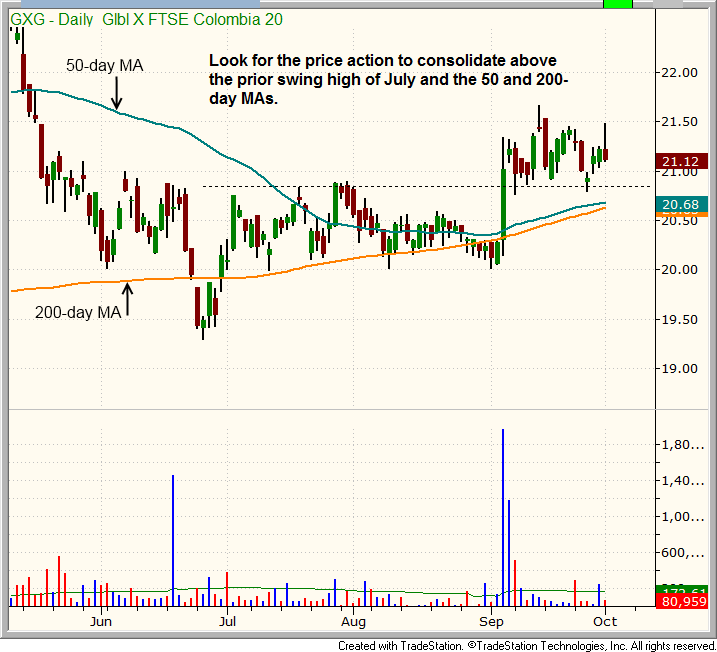
$GXG may need another week or two of basing above the moving averages and above the prior swing high of July (prior resistance should now become support). As of right now we do not have a low risk entry point but we will continue to monitor the action closely. The daily chart:
Our long position in the United States Natural Gas Fund (UNG) stopped just a few cents shy of our 22.58 target. Because of this, we are selling UNG at the open on Tuesday to lock in a 12% gain on just a five day hold (a $1,000 gain in the model portfolio). ALPS ETF Trust (AMLP) broke out above the range high but volume was lighter. Let’s see if the price action can follow through to the upside with an increase in volume over the next few days. As for the broad market, the fact that the averages were able to fight off distribution into the close yesterday was a good sign. That being said, we still can not rule out a pullback to the 50-day moving average on the S&P 500 or Nasdaq Composite.
stock commentary:
Both ALGN and DK triggered yesterday, with ALGN gaining 2.8% on a big pick up in volume. ALGN held up relatively well considering that most broad market averages closed in the bottom third of the day’s range. LNKD was the one weak link, as it sold off on higher volume and closed at the 20-day EMA. If the market breaks down LNKD will probably stop us out, as it doesn’t look to have enough relative strength to hold the 9/26 low.
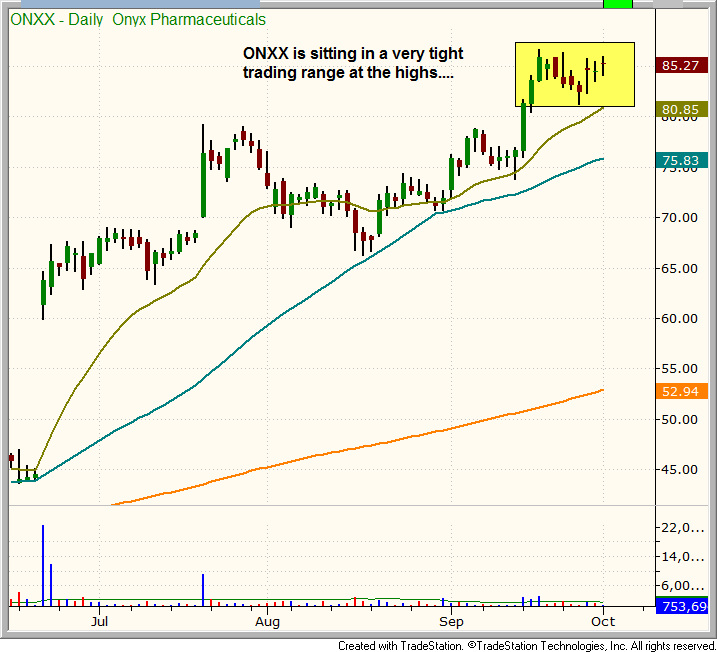
ONXX is in great shape but it eventually needs to move out here within the next day or two, as we prefer to see stocks breakout from tight continuation patterns in two weeks or less.
There are no new official setups for today. With six positions on, we’d like to see some more confirmation from open positions before adding more exposure.
If you are a new subscriber, please e-mail [email protected] with any questions regarding our trading strategy, money management, or how to make the most out of this report.
relative strength combo watchlist:
Our Relative Strength Combo Watchlist makes it easy for subscribers to import data into their own scanning software, such as Tradestation, Interactive Brokers, and TC2000. This list is comprised of the strongest stocks (technically and fundamentally) in the market over the past six to 12 months. The scan is updated every Sunday, and this week’s RS Combo Watchlist can be downloaded by logging in to the Members Area of our web site.