sell
today’s watchlist (potential trade entries):
open positions:
Below is an overview of all open positions, as well as a report on all positions that were closed only since the previous day’s newsletter. Net P/L figures are based on two separate $50,000 model portfolios (one for ETFs and one for stocks). Changes to open positions since the previous report are listed in red shaded cells below. Be sure to read the Wagner Daily subscriber guide for important, automatic rules on trade entries and exits.
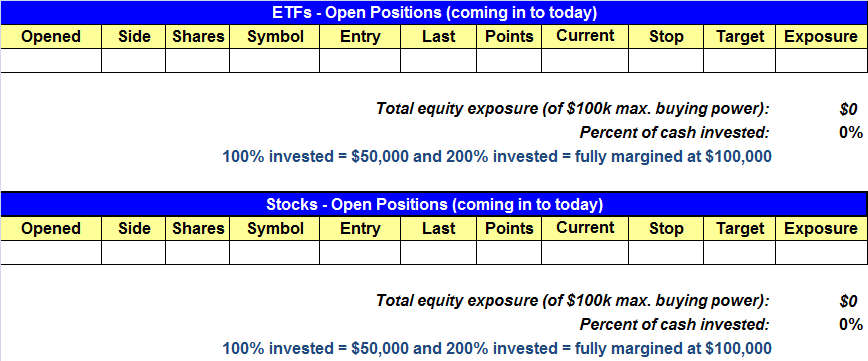
Having trouble seeing the open positions graphic above? Click here to view it directly on your web browser instead.
closed positions:
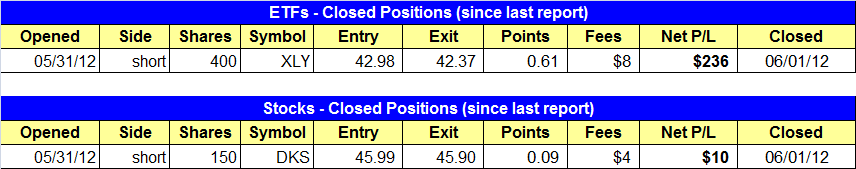
Having trouble seeing the closed positions graphic above? Click here to view it directly on your web browser instead.
ETF position notes:
- Closed XLY short position at market on the open for a + $200 gain.
stock position notes:
- Closed DKS short position at market on the open for a scratch gain.
ETF and broad market commentary:
Stocks got slammed on Friday as they put in the worst performance of 2012. All five major indices closed well in the red. High beta issues took the biggest hit yesterday. The small-cap Russell 2000, S&P MidCap 400 and the Nasdaq plunged 3.2%, 3.2% and 2.8% respectively. The S&P 500 fell 2.5%, while the Dow Jones Industrial Average lost 2.2%. Of the 107 market sectors that we track, 104 finished in the Red. Further, twenty sectors ended the day lower by four percent or more. Needless to say, Friday was a miserable day on Wall Street.
Surprisingly, market internals ended the day mixed. Volume fell on the Nasdaq by 6.8% but rose on the NYSE by 4.6%. Declining volume overwhelmed advancing volume on both exchanges. On the Nasdaq, the spread ratio ended the day at a whopping 21 to 1 in favor of declining volume. The NYSE saw declining volume overpower advancing volume by a sizeable 11.3 to 1. Irrespective of the lighter volume on the Nasdaq, Friday was clearly a distribution day for the broad market.
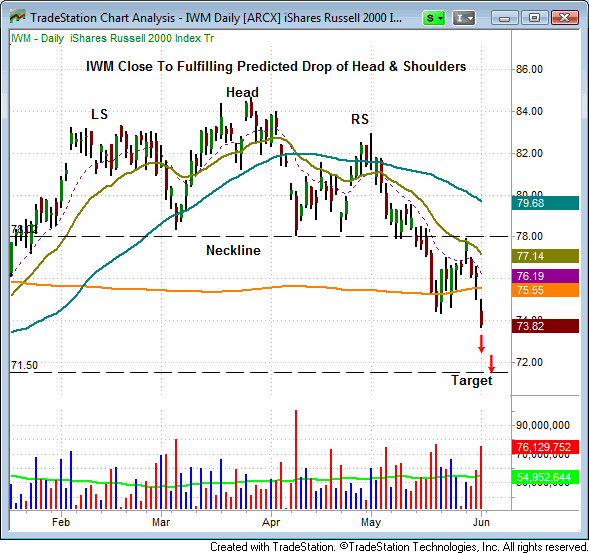
In the May 9th, 14th, 17th and 30th editions of the Wagner daily we discussed the head and shoulders pattern that was forming/had formed on the small-cap Russell 2000. In the May 9th newsletter we stated, “if the Russell 2000 loses support of the neckline at 785, then the predicted selloff would be to 720. We will be monitoring the Russell carefully, as its next test of the 785 mark could result in the loss of support and a significant move lower”. On May 14th we commented that, “(a move by IWM) below Friday’s low of $78.42 could result in a break of the neckline of the head and shoulders pattern. A drop below this key market would likely result in a quick move to the 200-day MA for IWM. On May 17th we stated that, “IWM did in fact breach its neckline and now appears headed for the 200-day MA. In all likelihood, IWM will find support at its 200-day MA. Typically, when a neckline of a head and shoulders pattern is broken, a subsequent bounce will occur back up into resistance near the neckline. This bounce generally results in another shorting opportunity.” (See IWM chart from May 17th Newsletter posted below).
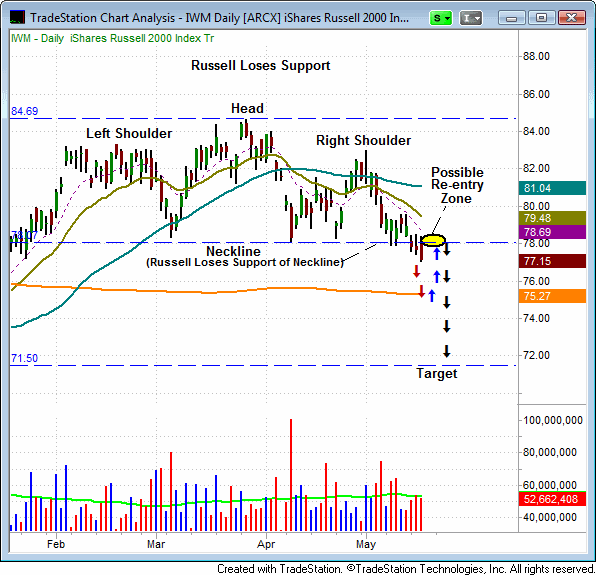
Friday’s chart of IWM shows that we are now within 2 ½ points of the predicted target for the head and shoulders pattern. It appears as if IWM will reach this target quickly, now that it has plunged below the nine day low.
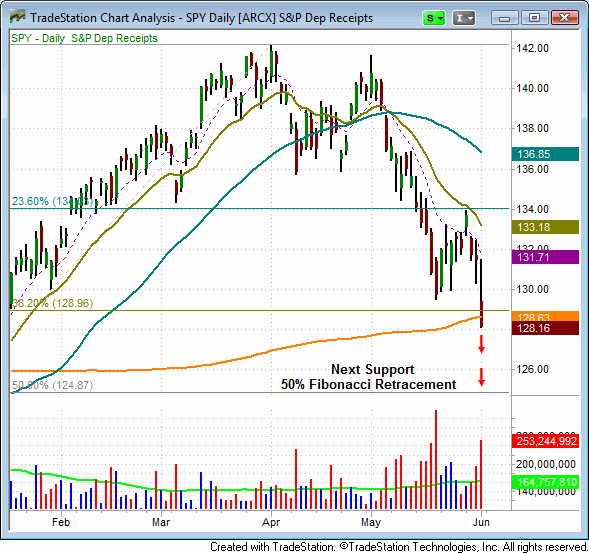
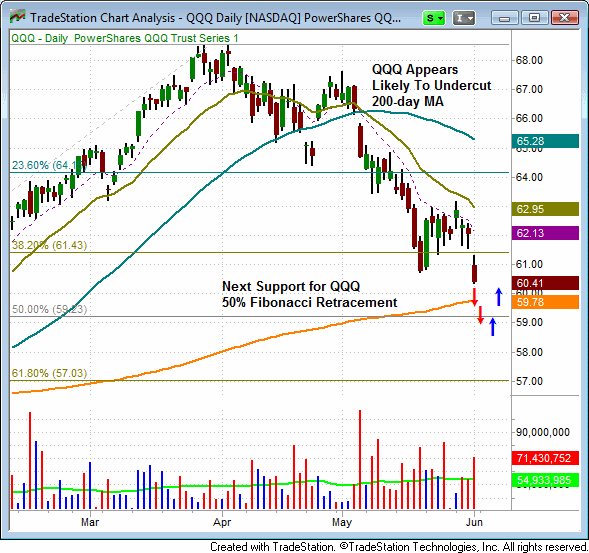
In addition to discussing the predicted target of IWM, we also recently stated that the SPY and QQQ would likely need to sharply undercut their respective 200-day MAs before a reversal of the current downtrend is likely to occur (See May 30th newsletter). Typically, in order for the market to reverse from a significant downtrend, a massive shakeout move is needed to both eliminate any remaining market bulls and to get a disproportionate number of bears into the market. Only then do reversals typically occur. On Friday, the SPY closed below support of its 200-day MA, while the QQQ closed just above its 200-day MA. The stage is now set for a significant move below this key mark on both indices (See S&P 500 and Nasdaq charts below).
Due to Thursday’s bullish price action, we sold our position in XLY at the open. We are now seeing the first signs of capitulation in the market. Friday was the worse point loss of the year. We are not looking to open new short positions at this juncture since the reward to risk ratio is no longer in our favor. This is not the time to chase the market lower. Friday’s move was difficult to participate in because, on a technical level, the main stock market indexes all formed bullish intraday reversal bars on Thursday, on sharply higher volume. This probably led technical traders to believe the next near-term move would be to the upside. So, when the market gapped substantially lower on Friday’s open, the bulls who bought on Thursday were trapped in their positions, which compounded the weakness in the market.
stock commentary:
Per Thursday night’s commentary, we closed out the DKS short position on Friday morning for a scratch. Although we would have loved to participate in Friday’s ugly selloff, the prior day’s strong reversal forced us to be more conservative with our money management. Having a disciplined approach doesn’t always lead to making the most money on a pariticular day, but over a period of time the good days outnumber the bad by a ton.
We cancelled the VVUS long setup from last Friday. Although its price action is strong the market did move to new lows and needs time to stablilize. We attempted to go long VVUS without a buy signal in place which we sometimes do when the market puts in a strong reversal as it did last Thursday (after establishing a swing low for at least one week). However, please note that when we do go long before a buy signal we do so with very small size and only take 1 or 2 positions. We do this because controlling risk is very difficult to do when we trade against the timing model. It is not something we do often and put much weight in to. We only test the waters once in a while with this strategy.
Friday’s plunge was the fist sign of market capitluation in a while. Capitulation as we define it is wholesale selling, with investors just thowing in the towel and wanting to get out of stock at any price. This is actually a good sign because capitulation usually creates a tradeable, intermediate-term bottom. These bottoms must be in for a market to stage a meaningful rally. Again, nothing is set in stone as we still may need several weeks of backing and filling in a range before the market is ready to launch higher.
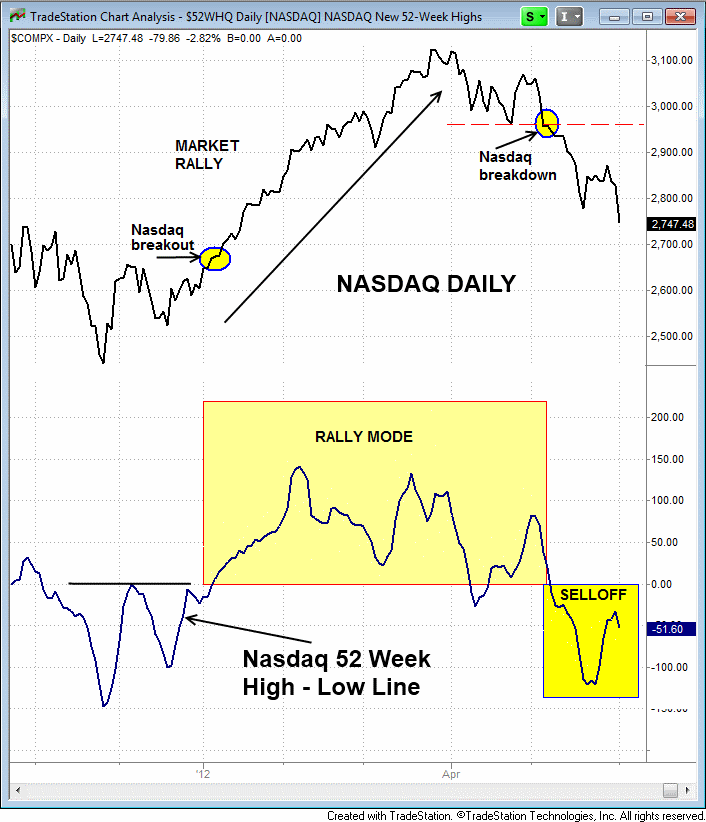
The chart below is a good example of how poor the market breadth currently is. The top portion is a daily line chart of the Nasdaq Composite. The bottom line is a 5-day moving average of the 52-week highs minus the 52-week lows. When this line is above zero and trending higher the market is in rally mode. Notice how the Nasdaq breakout in January of this year coincided with the 5-day moving average line pushing above zero. The opposite is true when the market broke down in late April/early May, as the 5-day moving average also moved back below zero and has been in negative territory ever since. The 52-week highs minus lows line is not a leading indicator and doesn’t play a big role in our market timing model, but it something we use as confirmation, as it would be tough for the market to put in a strong rally without the news highs list expanding.
If you are a new subscriber, please e-mail [email protected] with any questions regarding our trading strategy, money management, or how to make the most out of this report.
relative strength watchlist:
Our Relative Strength (or RS) Watchlist makes it easy for subscribers to import data into their own scanning software, such as Tradestation, Interactive Brokers, and TC2000. This list is comprised of the strongest 100 (or so) stocks in the market over the past six to 12 months. The scan is updated every Sunday, and this week’s RS Watchlist can be downloaded by logging in to the Members Area of our web site.