Current signal generated on close of June 25
Past signals:
- Neutral signal on the close of June 20
- Buy signal on the close of June 13
- Neutral signal on close of June 12
- Buy signal on the close of April 30
today’s watchlist (potential trade entries):

Having trouble seeing the open positions graphic above? Click here to view it directly on your web browser instead.
open positions:
Below is an overview of all open positions, as well as a report on all positions that were closed only since the previous day’s newsletter. Net P/L figures are based a $100,000 model portfolio. Changes to open positions since the previous report are listed in pink shaded cells below. Be sure to read the Wagner Daily subscriber guide for important, automatic rules on trade entries and exits.

Having trouble seeing the open positions graphic above? Click here to view it directly on your web browser instead.
closed positions:
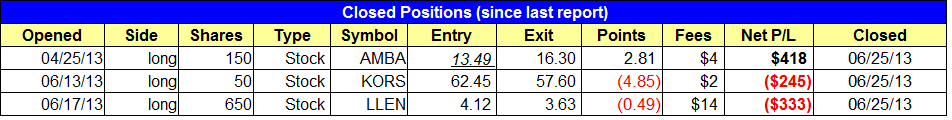
Having trouble seeing the closed positions graphic above? Click here to view it directly on your web browser instead.
ETF position notes:
- No trades were made.
stock position notes:
- Sold $AMBA on the open. Stopped out of $KORS and $LLEN.
ETF, stock, and broad market commentary:
Monday morning’s gap down erased any hope for the market to follow through on Friday afternoon’s rally. After a few hours of selling, the averages bottomed out and ripped higher through the lunchtime doldrums, with the S&P 500 rallying about 1.5% off the lows of the day by 2:30 pm. However, selling returned in the final hour of trading, preventing the averages from closing at the highs of the day and printing bullish reversal candles.
For the most part, all major averages closed down at least 1.0% on the day. Volume was lighter on both exchanges, but at this point further distribution is not necessary to drive the market lower (it can now fall from its own weight).
Yesterday’s selloff in the market sent the S&P 500 back to support from the prior major highs of 2000 and 2007, around 1,550. We’d like to see this level hold up as the market finds some traction over the next few weeks.
With all major averages now below the 50-day MA, the timing model is on a clear sell signal. While many IPOs have held up, current market conditions are simply too volatile to produce reliable buy setups. When volatility increases it becomes very hard to control risk due to gaps and wild trading action.
As far as the short side is concerned, it is simply too late to locate low risk short entries. Ideally, we’d like to see a decent bounce in the broad based averages to produce low risk short setups.
One potential short setup down the road is in the Market Vectors Steel ETF ($SLX), which has broken a clear support level and $40 and could possibly sell off to or near the lows of 2009:

This setup is not actionable on the daily chart, as the price action is quite a bit extended from a base or major moving averages. Ideally, we would like to see a bounce to the 10-day or 20-day EMA within the next few weeks to present us with a low risk entry point.

As for longs, SPDR S&P Bank ETF ($KBE) is one of the only ETFs still trading above the 50-day MA. It has clear pattern relative strength over the S&P 500, as evidenced by the chart below. $KBE (the bottom green line) has yet to break the lows of its current base, while the S&P 500 (top yellow line) has clearly broken down.

If $KBE’s relative strength continues, then it could be one of the first ETFs to hit new highs when the market finally bottoms out.
After stopping out of $LLEN and $KORS and locking in gains in $AMBA, we are now left with only one long position in $AWAY, which continues to hold up well.

A break above the horizontal line could lead to a move to the 31.50 – 32.00 area if the market is able to find some traction.
We are in no rush to grab long exposure until the market is able to find some traction. With the timing model in sell mode, we will probably only enter 1 or 2 positions with small size if tight pivot points develop. If the market rallies and the charts look ugly, then we will look to establish a few short positions.