Current buy signal was generated on the close of June 13
Past signals:
Neutral signal generated on close of June 12
Buy signal generated on the close of April 30
today’s watchlist (potential trade entries):

Having trouble seeing the open positions graphic above? Click here to view it directly on your web browser instead.
open positions:
Below is an overview of all open positions, as well as a report on all positions that were closed only since the previous day’s newsletter. Net P/L figures are based a $100,000 model portfolio. Changes to open positions since the previous report are listed in pink shaded cells below. Be sure to read the Wagner Daily subscriber guide for important, automatic rules on trade entries and exits.

Having trouble seeing the open positions graphic above? Click here to view it directly on your web browser instead.
closed positions:

Having trouble seeing the closed positions graphic above? Click here to view it directly on your web browser instead.
ETF position notes:
- $TAN gapped up more than 1.3% above our entry on the open so the trade was canceled. It remains on the watchlist with an entry over Monday’s high.
stock position notes:
- Bought $LLEN. Canceled the $AMBA buy limit order.
ETF, stock, and broad market commentary:
Stocks kicked off the week on a positive note yesterday, as broad market blew off last Friday’s pullback and built on the gains of the June 13 follow-through day. The main stock market indexes jumped roughly 0.8% each, as volume in both the NYSE and Nasdaq increased 8% above the previous day’s levels. The higher volume gains caused both the S&P and Nasdaq to register a bullish “accumulation day” that was indicative of the return of institutional buying. However, most of the day’s advance was the result of an opening gap up, as stocks subsequently chopped around in a sideways range the rest of the day.
In the June 13 issue of The Wagner Daily, we discussed the importance of the 50-day moving average as a technical indicator of intermediate-term trend. In the following session that day, the broad market scored a bullish follow-through day (advance of 1.5% or more on higher volume). This could be largely attributed to several of the major indices coming into support of their 50-day moving averages after weeks of price consolidation.
Now, just a few days later, several of the key stock market indexes are at key technical inflection points that will likely determine the sentiment of the stock market over the near to intermediate-term. One such example can be seen in the daily chart pattern of PowerShares QQQ Trust ($QQQ), a popular ETF proxy that tracks the Nasdaq 100 Index:

Since bouncing off its 50-day moving average (teal line) on June 13, $QQQ has rallied to close right at resistance of its downtrend line from its May 22 high. Because this is the high of the month-long price consolidation in the broad market, this is a key technical level to closely monitor. $QQQ tried to break out above this trendline yesterday, but did so unconvincingly by closing in the middle of its intraday range. Nevertheless, if $QQQ closes firmly above yesterday’s high, it will represent a real break of the downtrend line from the consolidation period, which could quickly enable stocks to rally back to test their prior highs.
It’s a similar situation in the iShares Russell 2000 Index ($IWM), an ETF that tracks the performance of small-cap stocks. Since the rallies of healthy markets are often led by money flow into small-cap growth stocks, it’s a good idea to keep an eye on the pattern of $IWM while the market is consolidating its gains after a rally:

Just like $QQQ, $IWM is also testing resistance of its downtrend line from the May 22 high. One difference between the two ETFs, however, is that $IWM has been so strong that it did not even come into contact with its 50-day MA during the correction. This, of course, is a bullish sign for the broad market (especially if $IWM clears yesterday’s high).
Going into today, there is one new ETF swing trade setup on our watchlist, which is US Oil Fund ($USO). This is a commodity ETF that approximately tracks the price of crude oil futures contracts. For quite some time, the price of oil has been in a range, but this appears to be changing and there may be a new bull market setting up in oil. Take a look at the weekly chart pattern of $USO below:

On the weekly chart, notice that $USO broke out above resistance of its “dirty” downtrend line a few weeks ago. This followed an “undercut” of its November 2012 lows that happened in April 2013. That move likely had the effect of washing out the last of the “weak hands” who wanted out, thereby absorbing overhead supply that will now enable $USO to more easily move higher.
Zooming into the shorter-term daily chart of $USO, we see that the ETF broke out above resistance of its short-term downtrend line (from the April 2 high) just two days ago and is holding the breakout. Although it obviously might have been better to buy on the day of the June 14 gap up, it is not too far gone to still have a decent buy entry above the two-day high (see today’s watchlist for exact trade details). Alternately, if it pulls back to support of the trend line first, we would consider a slightly lower risk entry point as well. Here is the daily chart pattern:

$LLEN buy entry triggered and exploded higher initially, but stalled out and reversed to close near the lows of the day. Although yesterday’s breakout was not the type of action we look for, if $LLEN can hold the 20-day EMA (minus a shakeout) the setup could still work.
We raised the stop on half the position in $OSTK due to the stalling action above 27.00. If $OSTK breaks the low of the 6/10 reversal candle we will sell half the position.
$AMBA set a new closing high on heavier than average volume. We are waiting for some sort of pullback or bull flag to develop so that we can add to the position.
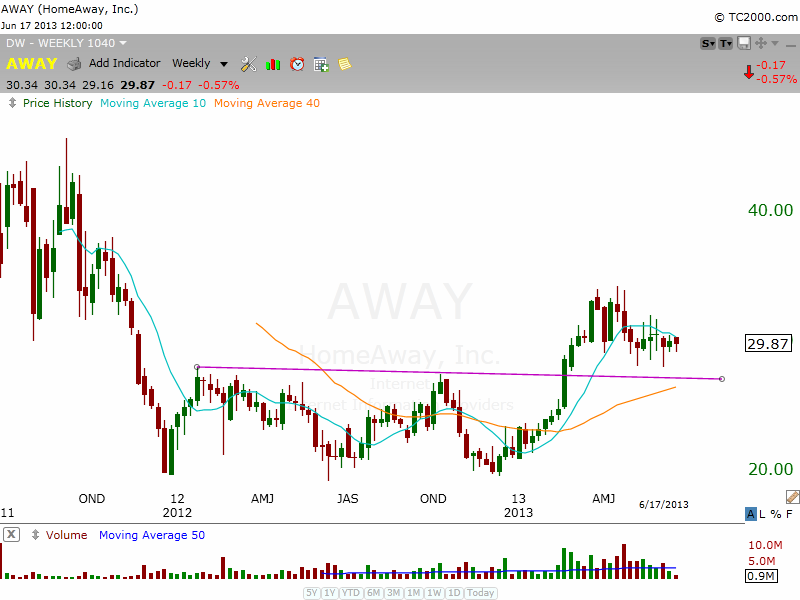
Homeaway ($AWAY) is an IPO from 2011 with a strong 5-year EPS growth rate of 116%, and an EPS ranking of 99. The weekly chart below shows the powerful thrust off the lows at $20 that led to a breakout above resistance at $28.

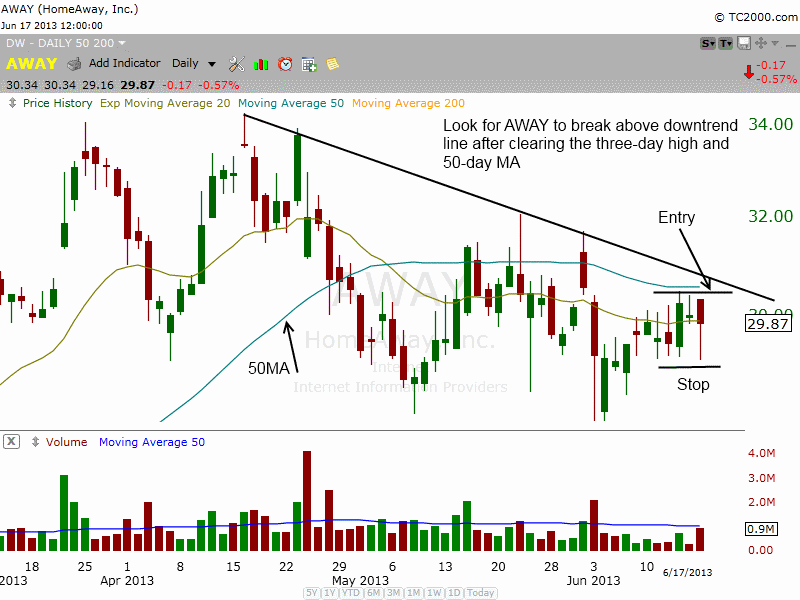
After stalling at $34, $AWAY has formed a bullish base less than 20% off the recent high, while holding above the prior resistance level at $28. Our buy entry is over the three-day high, which could spark a breakout above the downtrend line and 50-day MA.
