market timing model:
SELL – Signal generated on the close of July 10 (click here for more details)
today’s watchlist (potential trade entries):

open positions:
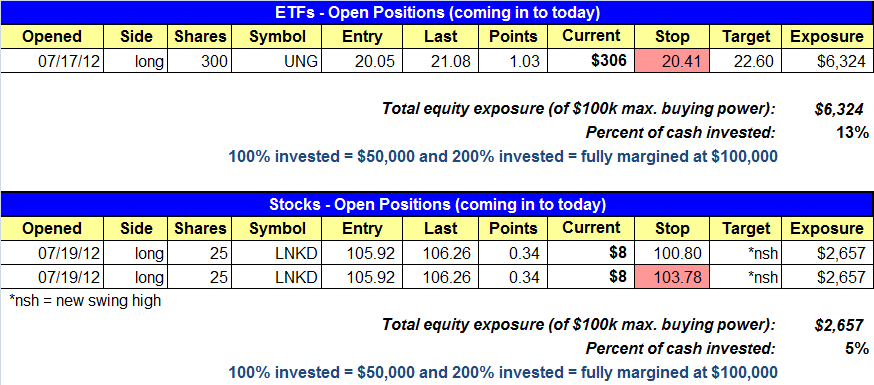
Below is an overview of all open positions, as well as a report on all positions that were closed only since the previous day’s newsletter. Net P/L figures are based on two separate $50,000 model portfolios (one for ETFs and one for stocks). Changes to open positions since the previous report are listed in red shaded cells below. Be sure to read the Wagner Daily subscriber guide for important, automatic rules on trade entries and exits.

Having trouble seeing the open positions graphic above? Click here to view it directly on your web browser instead.
closed positions:

Having trouble seeing the closed positions graphic above? Click here to view it directly on your web browser instead.
ETF position notes:
- Note new stop price in UNG.
stock position notes:
- GET buy setup cancelled for now.
- LNKD is listed twice in the open positions section due to the split stop.
ETF and broad market commentary:
Stocks got hit hard on Friday as volume expanded. The Dow Jones Industrial Average showed the most strength, as it contained losses to 0.9%. The S&P 500 slid 1.0% while the S&P MidCap 400 and the small-cap Russell 2000 shed 1.1% and 1.3% respectively. The Nasdaq was the day’s biggest loser. By the closing bell, the tech-rich index had shed 1.4%.
Market internals were bearish on Friday. Volume climbed by 17.7% on the NYSE and 2.6% on the Nasdaq. Declining volume outpaced advancing volume by a factor of 3.3 to 1 on the NYSE and 3.2 to 1 on the Nasdaq. Higher volume points to institutional participation in the selloff. As a result, we would label Friday as a distribution day on both exchanges.
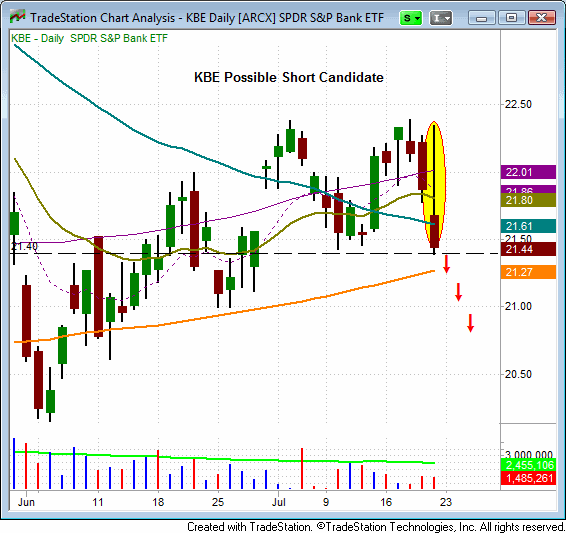
Yesterday, the SPDR S&P Bank ETF (KBE) formed a massive reversal candle, as it tested the four day high, but reversed to close near the nine day low. A volume fueled move below yesterday’s low of $21.40 could present a short entry trigger for this ETF.

UNG performed well on Friday, but volume was light and has been declining over the past two days. We would have liked to have seen volume expand on the breakout. Consequently, we are raising our stop in UNG. Trade specifics can be found in the open positions segment of the newsletter. The market continues to struggle in finding a direction and yesterday’s distribution suggests market bears could soon gain control of the action. Given Friday’s higher volume selling, we would expect to see follow through to the downside, at least at the open, on Monday.
stock commentary:
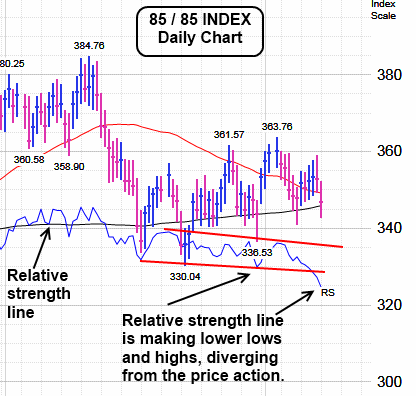
The chart below is the Investors Business Daily 85/85 Index, which is comprised of stocks that have an 85 or greater relative strength ranking and an 85 or greater fundamental ranking. This index represents some of the best growth stocks in the market. Note the diverging relative strength line below, which is making lower lows and highs while the index itself is making higher highs and lows. This indicates that the 85/85 index is weaker than the S&P 500, which is a concern for growth stock investors.

If you are a new subscriber, please e-mail [email protected] with any questions regarding our trading strategy, money management, or how to make the most out of this report.
relative strength watchlist:
Our Relative Strength (or RS) Watchlist makes it easy for subscribers to import data into their own scanning software, such as Tradestation, Interactive Brokers, and TC2000. This list is comprised of the strongest 100 (or so) stocks in the market over the past six to 12 months. The scan is updated every Sunday, and this week’s RS Watchlist can be downloaded by logging in to the Members Area of our web site.