sell
today’s watchlist (potential trade entries):
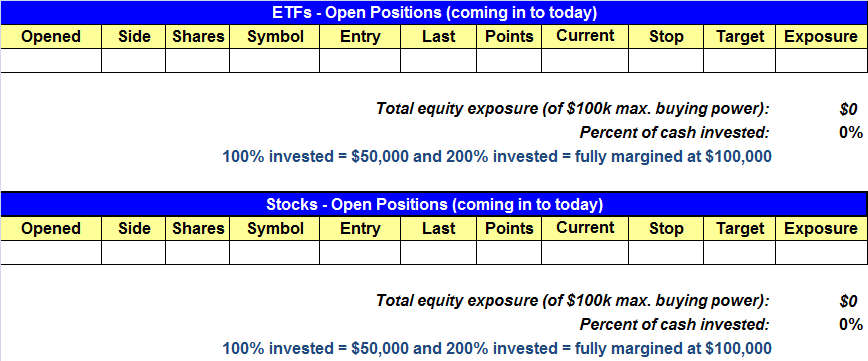
open positions:
Below is an overview of all open positions, as well as a report on all positions that were closed only since the previous day’s newsletter. Net P/L figures are based on two separate $50,000 model portfolios (one for ETFs and one for stocks). Changes to open positions since the previous report are listed in red shaded cells below. Be sure to read the Wagner Daily subscriber guide for important, automatic rules on trade entries and exits.
Having trouble seeing the open positions graphic above? Click here to view it directly on your web browser instead.
closed positions:

Having trouble seeing the closed positions graphic above? Click here to view it directly on your web browser instead.
ETF position notes:
- No trades were made.
stock position notes:
- No trades were made.
ETF and broad market commentary:
Stocks moved higher yesterday but trade was light. All five major exchanges closed in positive territory, with the S&P MidCap 400 leading the way. The midcap index climbed a solid 1.3% yesterday. The small-cap Russell 2000 finished a close second, as it tacked on 1.2. The Nasdaq, S&P 500 and Dow Jones Industrial Average tacked on 0.7%, 0.6% and 0.2% respectively.
Market internals ended on a mixed note for a third consecutive session. Volume fell on the Nasdaq by 8.5% and on the NYSE by 12.2%. However, advancing volume outpaced declining volume on both exchanges. On the Nasdaq, the spread ratio closed at 2.3 to 1 in favor of advancing volume, and on the NYSE the ratio was 3.7 to 1 in favor of advancing volume. Yesterday’s light volume suggests that institutions did not participate in the advance.
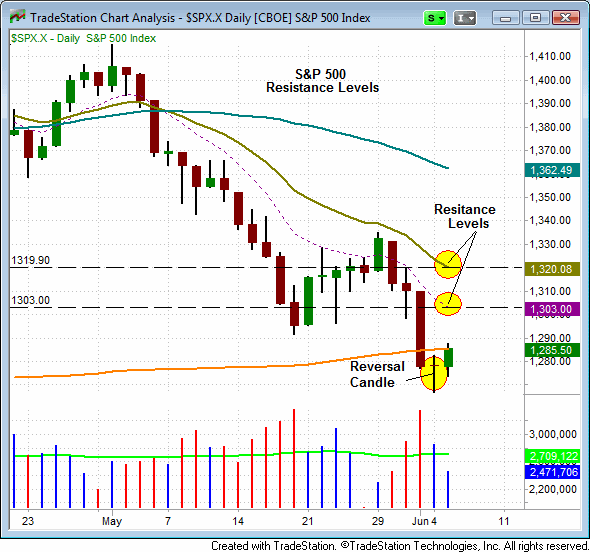
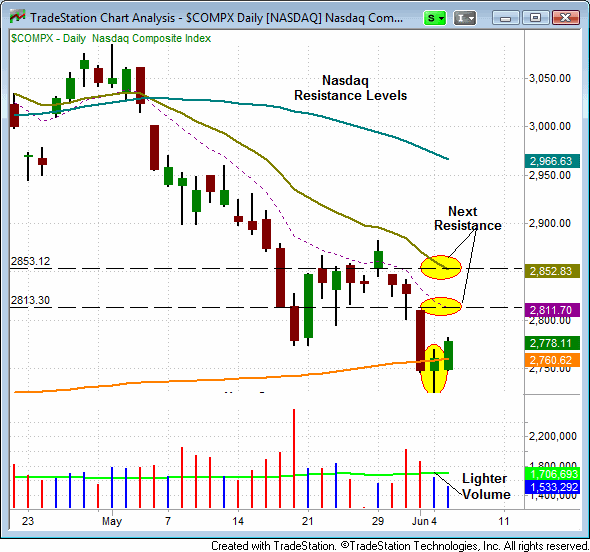
Over the past two days, the broad market appears to have put in a short term bottom. However, we are still in a downtrend and will be looking for shorting opportunities into any bounces. Below are charts of the Nasdaq and the S&P 500 that show the next significant resistance levels on both indices. Notice that volume has, thus far, been light compared to the volume during the recent decline. This type of volume action is typically viewed as bearish. We will be looking for the S&P and Nasdaq to form reversal candles near their respective 10-day and 20-day moving averages, as a signal for taking on potential new short positions.
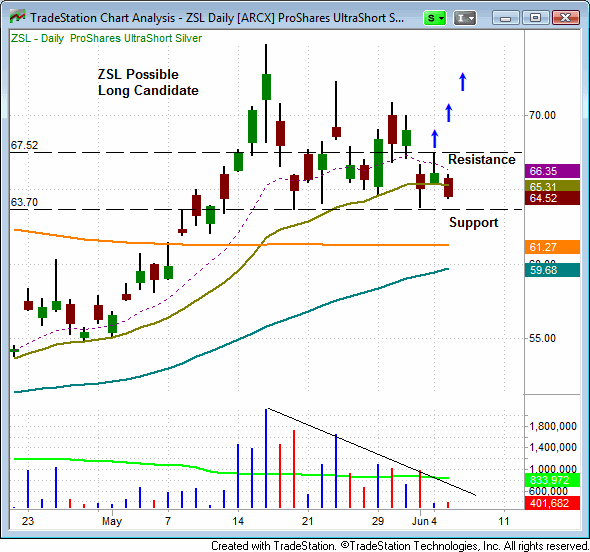
Since setting its most recent swing high on May 16th, the ProShares UltraShort Silver ETF (ZSL) has been consolidating at support of its 20-day EMA. Notice that during this consolidation period, volume has declined. This is generally considered a bullish signal when an ETF is consolidating during a significant trend. A move above the two day high of $67.52 could provide a buy entry signal for ZSL. We will continue to monitor this ETF as a possible long candidate.
With the market in the process of putting in a short term bottom (new swing low), we will be watching carefully for a significant accumulation day, as a possible signal for a trend reversal. Typically, we want to see a 1.5% gain in the Nasdaq and S&P 500, accompanied by higher volume. Until we see this type of price action, our prognosis for the market remains bearish, and we will continue to look for shorting opportunities into any rallies.
stock commentary:
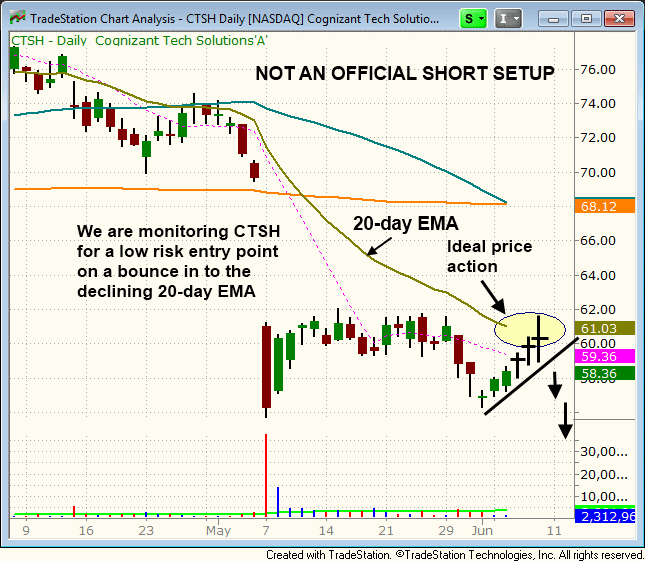
With the market attempting to push higher in the short-term, we are focused on monitoring setups for low risk entry points. CTSH is a potential short setup if it can bounce higher and form some sort of bearish reversal bar around the 20-day EMA:
For all those who are new to the newsletter please note that we are currently in S.O.H. (sit on hands) mode because there are very few if any solid reward to risk setups to be found. As mentioned yesterday, we follow a disciplined trading system. When market conditions are ideal (in a bull market) we are very active and will trade up to 10 positions or more in each portfolio. All of our trading is based on setups. We scan each night for setups that meet our criteria and have an edge. When there are no setups we lay low and sit in cash. Traders sometimes forget that sitting in cash is a position.
If you are a new subscriber, please e-mail [email protected] with any questions regarding our trading strategy, money management, or how to make the most out of this report.
relative strength watchlist:
Our Relative Strength (or RS) Watchlist makes it easy for subscribers to import data into their own scanning software, such as Tradestation, Interactive Brokers, and TC2000. This list is comprised of the strongest 100 (or so) stocks in the market over the past six to 12 months. The scan is updated every Sunday, and this week’s RS Watchlist can be downloaded by logging in to the Members Area of our web site.