Buy Mode
– Timing model generated buy signal on close of March 5 (click here for more details)
today’s watchlist (potential trade entries):

Having trouble seeing the open positions graphic above? Click here to view it directly on your web browser instead.
open positions:
Below is an overview of all open positions, as well as a report on all positions that were closed only since the previous day’s newsletter. Net P/L figures are based on two separate $50,000 model portfolios (one for ETFs and one for stocks). Changes to open positions since the previous report are listed in pink shaded cells below. Be sure to read the Wagner Daily subscriber guide for important, automatic rules on trade entries and exits.
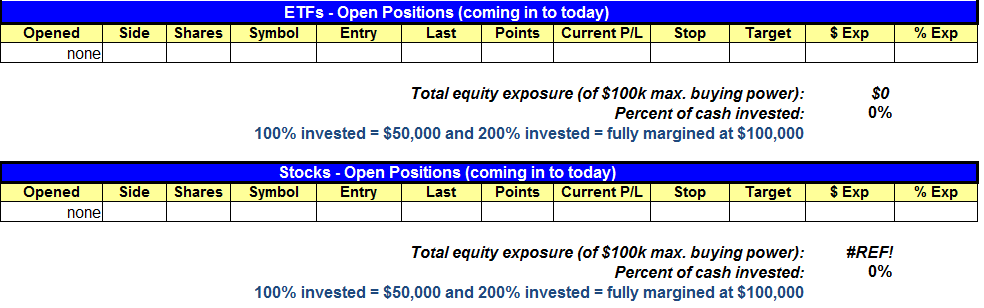
Having trouble seeing the open positions graphic above? Click here to view it directly on your web browser instead.
closed positions:
Having trouble seeing the closed positions graphic above? Click here to view it directly on your web browser instead.
ETF position notes:
- No trades were made.
stock position notes:
- No trades were made.
ETF, stock, and broad market commentary:
Stocks failed to extend on Wednesday’s impressive advance, with most broad market averages selling off into the close and finishing in the lower half of the day’s range. The only strike against yesterday’s action was that volume did increase on the NYSE. After a strong day up, we prefer to see volume contract if the next day is a tight-ranged inside day.
Since the morning gap up to new swing highs and follow through in the first two hours of trading on Wednesday, the S&P 500 and Nadsaq Composite have basically chopped around in a tight range, forming a bull flag type pattern on the hourly chart (about 12 bars sideways).
Although the market has broken out to new swing highs, our ETF scans have not produced many high quality breakout candidates. First Trust Dow Jones Internet Index ($FDN) is a potential breakout candidate we have been monitoring for several weeks now. The monthly chart below shows the heavy volume breakout to new highs.

This is the first consolidation after a big breakout, so we believe that $FDN has more upside if the market remains healhty.
We originally liked $FDN as a continuation breakout on 2/14, 2/15, and 2/19, but the price action failed to follow through and reversed sharply to the lows of the range.

$FDN rallied right back up to the highs of range and broke out on Wednesday, but volume was light and the price action failed to close above the range highs. If $FDN chops around for a few days and holds above 43.00, then we could see a breakout develop next week.
Part of our daily routine is monitoring the top industry groups in the market. Whether we look at the ETF or the stocks, this analysis comes in handy when top groups pull back in off the hows. How these groups react after a sharp selloff is very important. For example, in early November, iShares Dow Jones US Home Construction ($ITB) broke down below the 50-day MA from a tight-ranged consolidation. The pick up in volatility was a concern, as this was a leading industry group during the last rally. On the chart below, note the pick up in volatility in November that was immediately followed by tight price action over the next few weeks, which was a bullish sign.

$ITB once again ran into some heavy selling with a big pick up in volatility from 2/19 to 2/25. The price action has since rebounded to the highs of the range, but needs to tighten up over the next few weeks in order to produce a reliable entry point.
On the stock side, we are monitoring a few setups for potential entry points. $ARMH, $NFLX, $WGO, $CVLT, $ALNY, $SODA, $BX, and $S are a few that could be ready to go late this week or within the next two weeks.
$OPEN, $WDAY, $SLFY, and $SLCA are strong breakouts from quality basing action, but are too extended at this point for low-risk entry points, as they ran up while the timing model was on a sell signal. We will monitor these stocks for pullback entries next week but for now there isn’t much that is actionable.
relative strength combo watchlist:
Our Relative Strength Combo Watchlist makes it easy for subscribers to import data into their own scanning software, such as Tradestation, Interactive Brokers, and TC2000. This list is comprised of the strongest stocks (technically and fundamentally) in the market over the past six to 12 months. The scan is updated every Sunday, and this week’s RS Combo Watchlist can be downloaded by logging in to the Members Area of our web site.