Buy Mode
– Timing model generated buy signal on close of March 5 (click here for more details)
today’s watchlist (potential trade entries):

Having trouble seeing the open positions graphic above? Click here to view it directly on your web browser instead.
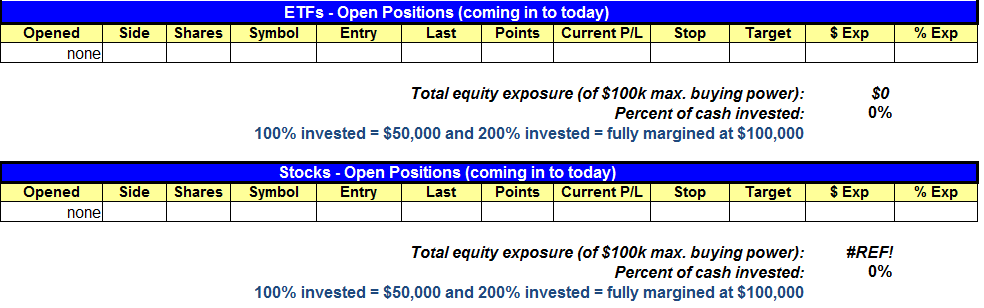
open positions:
Below is an overview of all open positions, as well as a report on all positions that were closed only since the previous day’s newsletter. Net P/L figures are based on two separate $50,000 model portfolios (one for ETFs and one for stocks). Changes to open positions since the previous report are listed in pink shaded cells below. Be sure to read the Wagner Daily subscriber guide for important, automatic rules on trade entries and exits.
Having trouble seeing the open positions graphic above? Click here to view it directly on your web browser instead.
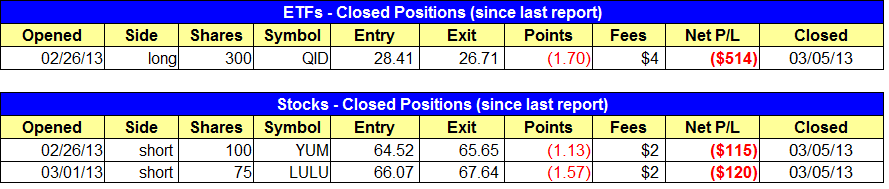
closed positions:
Having trouble seeing the closed positions graphic above? Click here to view it directly on your web browser instead.
ETF position notes:
- $QID stop triggered.
stock position notes:
- $LULU and $YUM shorts were closed on the open.
ETF, stock, and broad market commentary:
Following through on two consecutive days of bullish intraday reversals, stocks gapped above key resistance levels yesterday morning and held onto their gains throughout the entire session. Each of the main stock market indexes jumped an average of just over 1%, with the rare instance of the Nasdaq showing leadership among the major indices. For the first time in weeks, the broad-based advance was also confirmed by higher volume across the board. Total volume the Nasdaq was 10% higher than the previous day’s level, while turnover in the NYSE ticked 4% higher.
Yesterday’s broad market performance was impressive, and admittedly a bit surprising. The major indices have now absorbed recent overhead supply and have broken out above pivotal technical levels of resistance. Most importantly, higher volume finally confirmed the rally for a change. All of this means that our previous intermediate-term “sell” signal on the market is now invalid, and our stock market timing model has shifted back into (cautious) “buy” mode.
Obviously, we were wrong about our expectation and timing for stocks to enter into a significant near to intermediate-term correction. But does that mean our system for timing the market no longer works? Of course not! No technical signal provides 100% accuracy (or we would already be gazillionaires). However, in three of the last four times that our market timing strategy generated a “sell” signal (April 2012, May 2012, and October 2012), it was followed by a broad-based correction of 5 to 10% below the highs (review details of the three most recent sell signals here).
This time, despite the overly bearish volume patterns in the market until yesterday, the “sell” signal simply did not work. Nevertheless, our reliance and confidence in our rule-based market timing technique has not changed one bit. Remember, we never try to predict future market action. Rather, our modus operandi is always to merely react to what the market is showing us at any given time. Now that the market is telling us to be long again, we are back to looking for stocks and ETFs breaking out to new highs, as well as equities with relative strength that have already broken out and are pulling back to support.
One ETF on our radar screen for potential pullback buy entry is iShares Nasdaq Biotech Index ($IBB). We mentioned this ETF two days ago as being in one of the only industry sectors with relative strength to the broad market (healthcare). With support of the healthcare sector confirming the move higher, we are now looking for a low-risk buy entry into $IBB on a pullback.
First, let’s take a look at the longer-term weekly chart, which shows that $IBB just broke out above a valid base of consolidation last week:

Now, let’s drill down to the shorter-term daily chart interval to take a look at our ideal “buy zone,” the area we would like to see $IBB retrace to in order to buying this ETF on a pullback:

The rectangular area on the chart above is our ideal “buy zone” for $IBB ($149 to $150 range). A pullback to this level would be just above the recent breakout on the weekly chart, which should now act as new support. Furthermore, this range represents a Fibonacci retracement of 38.2% to 50% (from the swing low of February 26 to yesterday’s (March 5) intraday high. We will be stalking this ETF for pullback buy entry in the coming days, and will be sure to notify subscribers in advance of our exact trigger, stop, and target prices for the $IBB swing trade setup if it approaches our target buy zone.
On the stock side, both short positions were closed on the open to limit losses. As traders we can’t worry about being wrong, but we can do our best to limit the damage done once we figure out that we are on the wrong side of the market.
The fact that the market pushed to new swing highs means that we can no longer be in sell mode. The point of the model in the first place is to aid us in establishing if the trend is up or down, so if a market is making new highs it is definitely not in a downtrend.
There are no new official trades for today. We are monitoring a few buy setups for potential entry points later this week or sometime next week depending on how the market holds up. As always, we want to let the setups bring us back into the market and not force the issue.
$SODA is setting up on the long side but may need another week or two before it is ready:

Ideally, we’d like to see the action rally up to the downtrend line and stall for a few days to form a higher swing low. This setup is not official.
Please realize that it’s okay to be wrong in your trade expectations (ie. expecting the market to go down, but it rallies instead), but you can’t stay wrong. Put simply, brush the dust off and move on when you’re wrong; don’t fight the market trend. Still, this does not mean it’s time to immediately jump back into the market in full force and start buying everything in sight. Instead, consider waiting a few days to ensure yesterday’s breakout holds up. If it does, there will be plenty of time to profit from new long positions if the broad market starts a new leg up.
relative strength combo watchlist:
Our Relative Strength Combo Watchlist makes it easy for subscribers to import data into their own scanning software, such as Tradestation, Interactive Brokers, and TC2000. This list is comprised of the strongest stocks (technically and fundamentally) in the market over the past six to 12 months. The scan is updated every Sunday, and this week’s RS Combo Watchlist can be downloaded by logging in to the Members Area of our web site.