Confirmed Buy– Signal generated on the close of January 22 (click here for more details)
today’s watchlist (potential trade entries):

Having trouble seeing the open positions graphic above? Click here to view it directly on your web browser instead.
open positions:
Below is an overview of all open positions, as well as a report on all positions that were closed only since the previous day’s newsletter. Net P/L figures are based on two separate $50,000 model portfolios (one for ETFs and one for stocks). Changes to open positions since the previous report are listed in pink shaded cells below. Be sure to read the Wagner Daily subscriber guide for important, automatic rules on trade entries and exits.
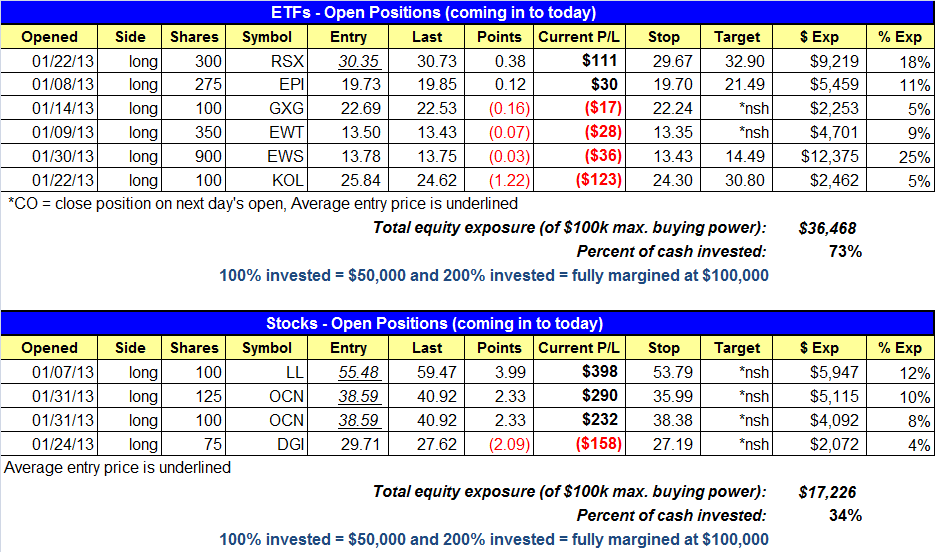
Having trouble seeing the open positions graphic above? Click here to view it directly on your web browser instead.
closed positions:
Having trouble seeing the closed positions graphic above? Click here to view it directly on your web browser instead.
ETF position notes:
- No trades were made.
stock position notes:
- No trades were made.
ETF, stock, and broad market commentary:
Sotcks gapped higher and followed through intraday, reclaiming most if not all of Monday’s losses before pulling back slightly in to the close. The percent gains were solid across the board, with the Nasdaq Composite leading the way at +1.3%. The markets followed up Monday’s light volume selloff with a bullish accumulation day, as turnover increased by 7% in the NYSE and 15% in the Nasdaq.
As mentioned in yesterday’s report, Monday’s light volume was key as it allowed the averages to escape a distribution day. It is important to note that we are not in the business of forecasting short-term counter-trend moves within a rally. That is why we focus on the health of stocks and distribution days in the averages. As long as the distribution days do not mount and stocks continue to hold up, then we do not mind the market pulling back for few days.
After breaking out from a three-month long base in December, iShares MSCI Emerging Markets Index Fund ($EEM) rallied about 10% to $45 before stalling out. During the past few weeks $EEM has pulled back gently off the highs in orderly fashion, and is now attempting to set a higher swing low within the base.

The base stopped just shy of the 50-day MA, but did touch the 10-week moving average on the weekly chart, which is a big institutional support level in an uptrend. If $EEM can climb back above the two-day high and the 20-day EMA and hold, then we could see a buy setup develop within the next few days with a higher low in place. If $EEM undercuts the 50-day MA but forms a bullish reversal candle, then we could potentially have a legitimate pullback entry off the 50-day MA.
On the stock side we continue to hold on to $OCN, which is looking pretty good with Tuesday’s breakout on a pick up in volume. $LL also reclaimed all of Monday’s losses. $DGI isn’t looking too good but we still have partial size with a stop below the 1/23 reversal candle low.
We have two new buy setups on today’s watchlist. The first setup is a buy on weakness in $BAC. We are looking for a slight pullback from yesterday’s move out, so we are placing a BUY LIMIT ORDER at 11.80. We will only buy if the price action pulls back to 11.80. If the price pulls back to 11.80 and you are not immediately filled, please enter at the market ASAP. Do not miss the setup because the price bounced back to 11.83 and you do not want to pay up. Please remember that we are swing traders, so paying up a few cents is not a big deal when we are playing for points.

We plan to bump up the share size to full (around 20%) if a low risk buy entry should develop at or around the highs of the range.
$SCTY is a recent IPO that has been in consolidation mode for a few weeks after an explosive move off the $10 level. Its relative strength ranking is 94 and the industry group ranking is #2 out of 197. We are keeping the share size small because $SCTY is a volatile stock even though it is only $15.

If you are a new subscriber, please e-mail [email protected] with any questions regarding our trading strategy, money management, or how to make the most out of this report.
relative strength combo watchlist:
Our Relative Strength Combo Watchlist makes it easy for subscribers to import data into their own scanning software, such as Tradestation, Interactive Brokers, and TC2000. This list is comprised of the strongest stocks (technically and fundamentally) in the market over the past six to 12 months. The scan is updated every Sunday, and this week’s RS Combo Watchlist can be downloaded by logging in to the Members Area of our web site.