today’s watchlist (potential trade entries):

open positions:
Below is an overview of all open positions, as well as a report on all positions that were closed only since the previous day’s newsletter. Net P/L figures are based on two separate $50,000 model portfolios (one for ETFs and one for stocks). Changes to open positions since the previous report are listed in a pink shaded cell below. New entries are shaded in green cells. Be sure to read the Wagner Daily subscriber guide for important, automatic rules on trade entries and exits.
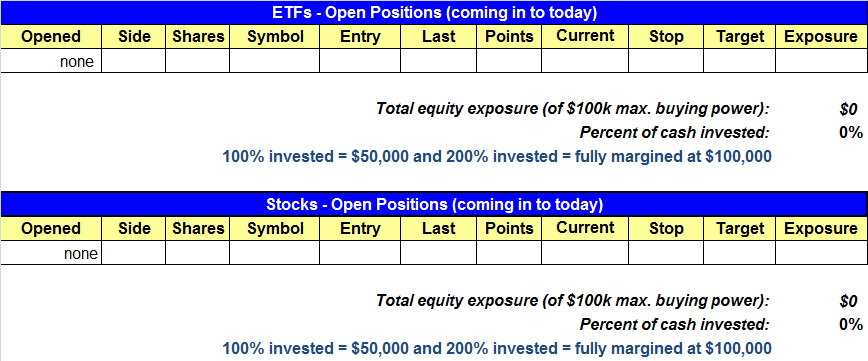
Having trouble seeing the open positions graphic above? Click here to view it directly on your web browser instead.
closed positions:

Having trouble seeing the closed positions graphic above? Click here to view it directly on your web browser instead.
ETF position notes:
- No trades were made.
stock position notes:
- No trades were made.
ETF and broad market commentary:
Stocks closed lower yesterday but well off the day’s lows. After a significant morning gap down and test of Tuesday’s lows, all of the major indices recovered to close in the upper half of their respective trading ranges. The Nasdaq and the S&P MidCap 400 both lost 0.4% yesterday, while the small-cap Russell 2000 fell 0.5%. The S&P 500 and the Dow Jones Industrial Average showed the most relative weakness, as they slid 0.7% and 0.8% respectively.
Market internals ended the day mixed on the Nasdaq and bearish on the NYSE. Volume fell on the Nasdaq by 5.0% but rose on the NYSE by 3.6%. Declining volume easily topped advancing volume by a ratio of 2.1 to 1 on the NYSE but ended the day at 1 to 1 on the Nasdaq. Despite the recovery off its intraday lows, Tuesday’s negative price action and higher volume on the NYSE combined to result in a distribution day for this index.
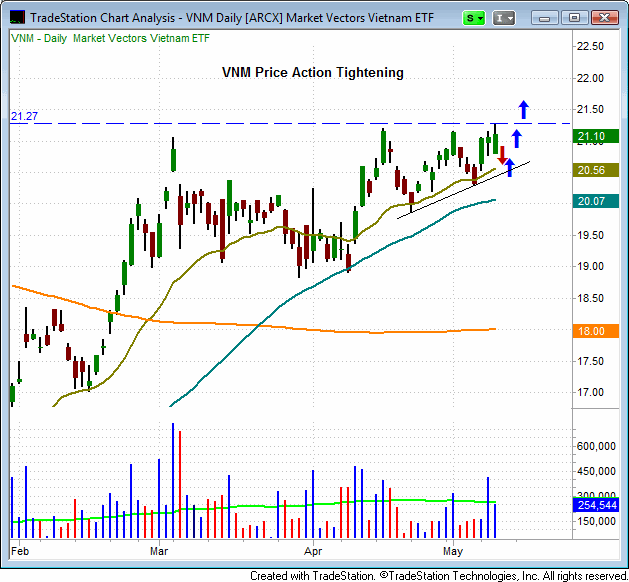
Since mid April, the Market Vectors Vietnam ETF (VNM) has been setting a sequence of higher lows, as it has consolidated along its 20-day EMA. This is an excellent exhibition of relative strength since most ETFs have lost support of both their 20-day and 50-day moving averages during the most recent bout of selling. If the market posts a buy signal and VNM is able to maintain support at the 20-day EMA, it could offer a buying opportunity on a move above resistance near $21.30.
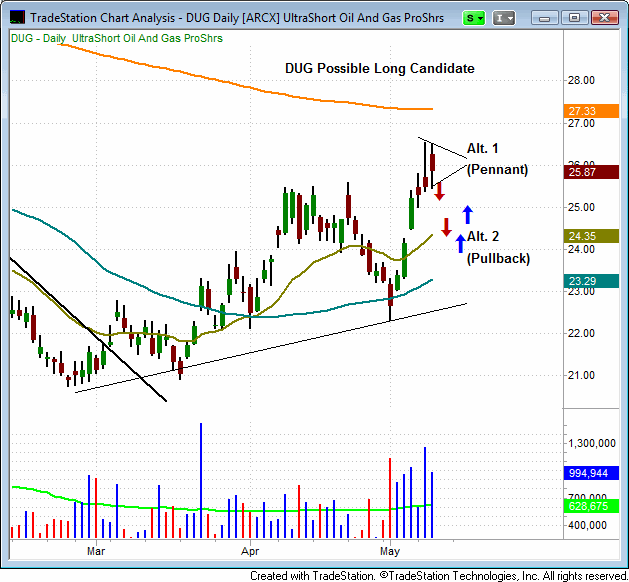
The ProShares UltraShort Oil and Gas ETF (DUG) reversed a long term downtrend starting in mid March by setting a sequence of higher highs and higher lows over the past two months. DUG could present a buying opportunity if it continues to consolidate near its present highs (forms a pennant), or on a pullback into support of its 20-day and/or 50-day moving averages. We will continue to monitor DUG for a potential long opportunity.
The market continues to exhibit weakness but all of the major indices managed to either hold or recover to close above Tuesday’s lows. We expect to see a bounce in the market over the next few days. The a big key to the market’s recovery is whether or not the major indices can hold the two day low and then post a significant accumulation day three or four days from now. However, if the market bounces into resistance on light volume, we will be looking to take on new short positions.
stock commentary:
With the broad market averages in deeply oversold territory there isn’t much out there in terms of a low risk setup on the short side.
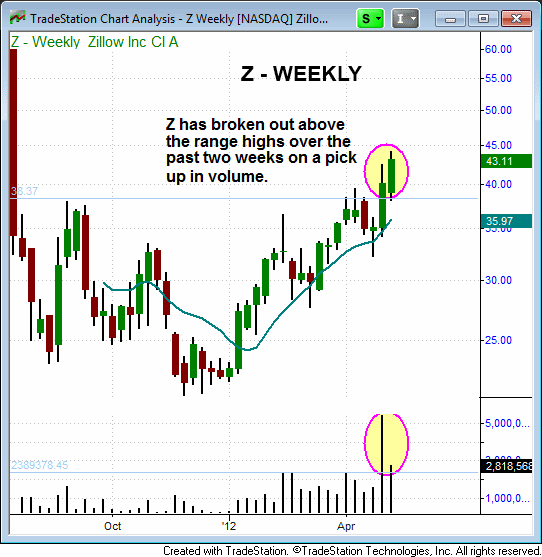
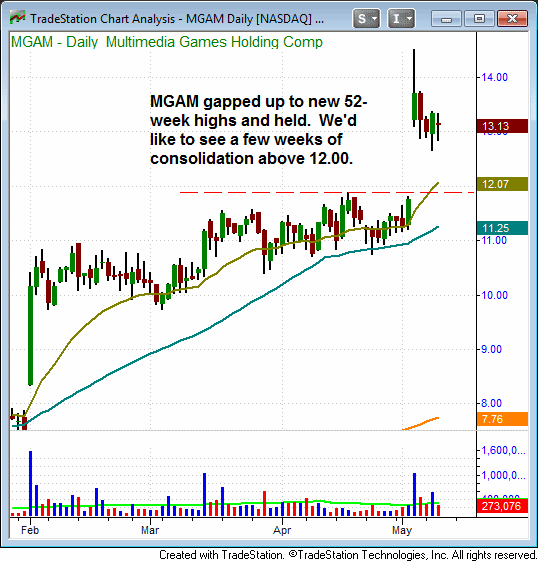
Below are a few more potential leadership stocks on our top watchlist. We will have a full watchlist available for scanning by next Monday.
If you are a new subscriber, please e-mail [email protected] with any questions regarding our trading strategy, money management, or how to make the most out of this report.