ETFs and market commentary:
Equities traded mixed on Wednesday on slightly higher trade. For much of the session all five major indices traded modestly higher but late selling pressure pulled three of the five indices into the red. The Dow Jones Industrial Average was the biggest loser on the day, as it fell 0.4%. The S&P 500 and the S&P MidCap 400 shed 0.2% and 0.1% respectively. The small-cap Russell 2000 showed the most strength on the day. The high beta index closed the session up 0.1%, while the Nasdaq closed fractionally higher. Non ferrous metals, transportation and telecommunication all fared well yesterday, while oil services, insurance and gold all struggled.
In what has become a common pattern lately, market internals ended the day mixed. Volume on both exchanges closed up by 1.7%. However, declining volume outpaced advancing volume on the NYSE by 1.2 to 1, while on the Nasdaq advancing volume topped declining volume by 1.1 to 1. The NYSE actually posted a distribution day yesterday, as it fell 0.3% on higher volume and higher declining volume. Although the Nasdaq saw higher volume and higher advancing volume, its price action was not strong enough to qualify for an accumulation day. Generally we like to see an index close higher by 0.3% or more to qualify for an accumulation day.
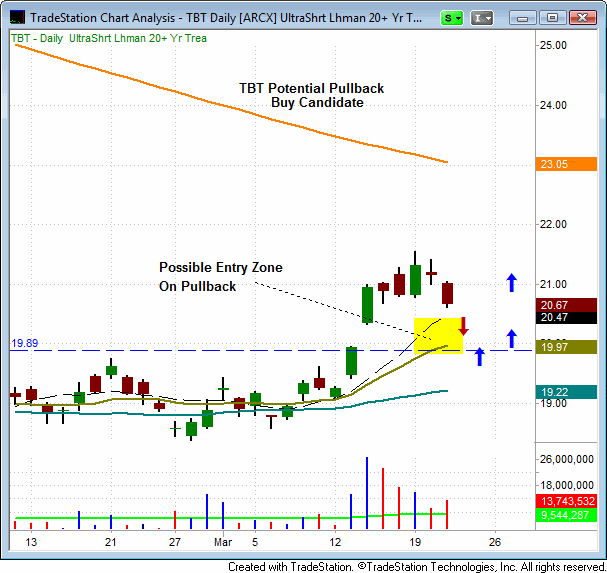
Since setting a swing high on March 19th, the ProShares UltraShort Lehman 20+ Bond Fund (TBT) has pulled back over the past two sessions and is nearing support of its 10-day MA. An undercut of the 10-day and/or 20-day moving averages could present a buying opportunity in TBT. We will be watching for a reversal candle to form near either of these two moving averages, as a signal for a potential pullback long entry.
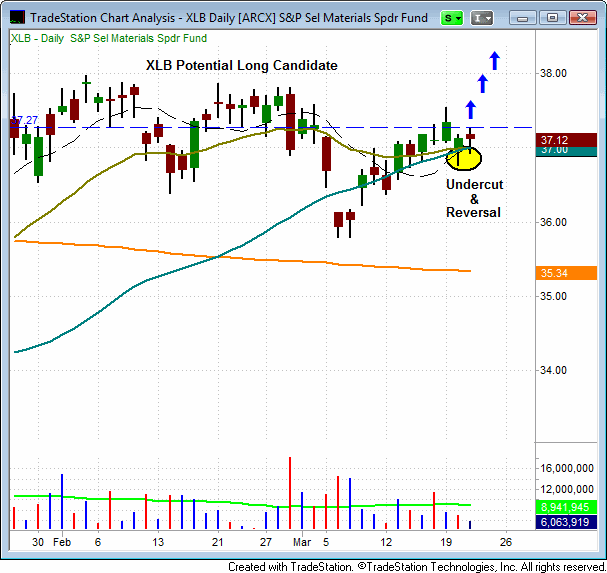
Over the past two sessions, the S&P SPDR Select Materials Fund (XLB) has formed back to back reversal candles as it has tested support of its 20-day and 50-day Moving averages. A volume assisted move above yesterday’s high of $37.27 could present a buying opportunity in XLB.
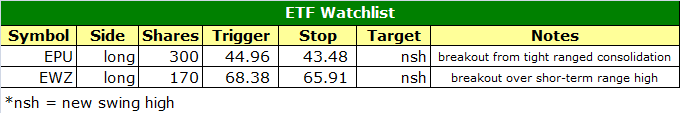
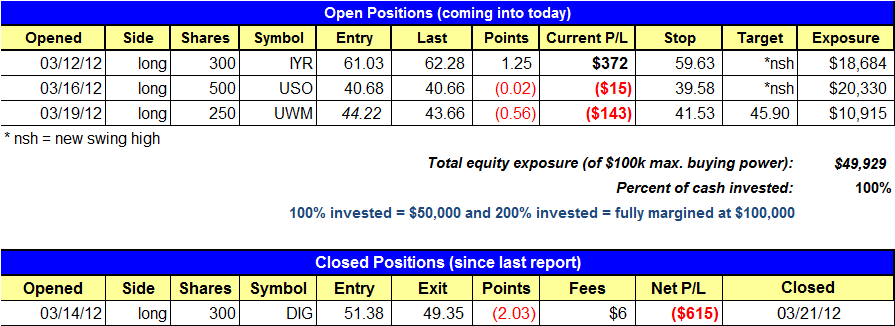
DIG hit its stop yesterday and we exited the trade. Both UWM and IYR spent the day consolidating within their respective two day ranges. USO showed early strength as it rallied above Tuesday’s high. However, at the 2:30 reversal period USO came under selling pressure and gave back most of its early session gains. Our watchlist candidate, EPU, finished strong and is now within striking distance of its trigger. The market struggled to find direction yesterday. We wouldn’t be surprised to see similar price action for several days before potentially resuming the broad market uptrend.
Today’s ETF Watchlist:
Daily Performance Report:
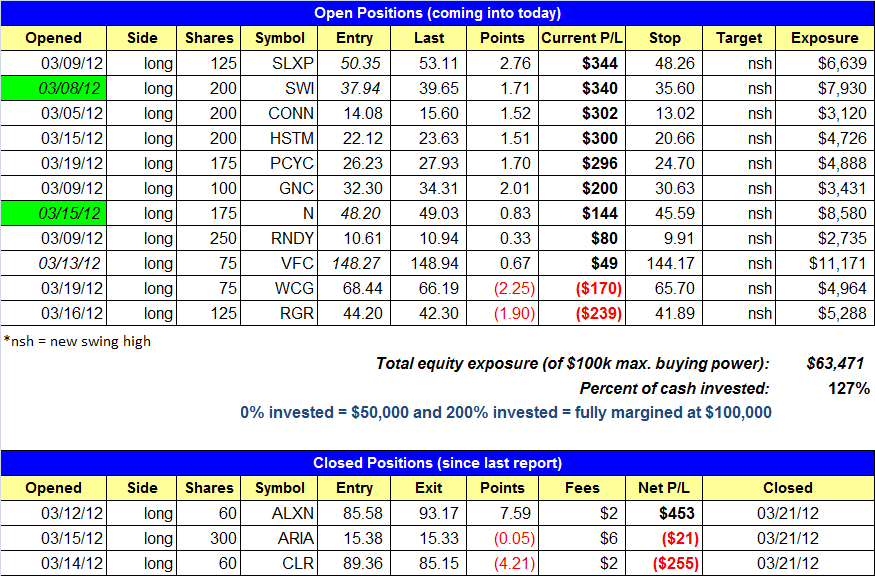
Below is an overview of all open positions, as well as a performance report on all positions that were closed only since the previous day’s newsletter. Net P/L figures are based on the $50,000 Wagner Daily model account size. Changes to open positions since the previous report are listed in red text below. Please review the Wagner DailySubscriber Guide for important, automatic rules on trigger and stop prices
Having trouble seeing the position summary graphic above? Click here to view it directly on your Internet browser instead.
Notes:
- DIG triggered the stop and we are now out.
- Reminder to subscribers – Intraday Trade Alerts to your e-mail and/or mobile phone are normally only sent to indicate a CHANGE to the pre-market plan that is detailed in each morning’s Wagner Daily. We sometimes send a courtesy alert just to confirm action that was already detailed in the pre-market newsletter, but this is not always the case. If no alert is received to the contrary, one should always assume we’re honoring all stops and trigger prices listed in each morning’s Wagner Daily. But whenever CHANGES to the pre-market stops or trigger prices are necessary, alerts are sent on an AS-NEEDED basis. Just a reminder of the purpose of Intraday Trade Alerts.
- For those of you whose ISPs occasionally deliver your e-mail with a delay, make sure you’re signed up to receive our free text message alerts sent to your mobile phone. This provides a great way to have redundancy on all Intraday Trade Alerts. Send your request to [email protected] if not already set up for this value-added feature we provide to subscribers.
Per intraday alert, we sold ALXN in to strength to lock in gains. Those who did not exit ALXN may do so on the open today. We also sold ARIA for a break-even scratch due to the stalling action at the 15.50 since 3/15. CLR triggered the stop and we are now out of the position. CLR is no longer a pullback setup as it now needs to form a legit base of four weeks or more, with at least one higher low. We will continue to monitor CLR and other stocks within the industry group for a low-risk entry point. We added to SWI and N on the open yesterday. Both stocks put in a strong up day on higher volume.
Today’s Stock Watchlist:
Daily Performance Report:
Below is an overview of all open positions, as well as a performance report on all positions that were closed only since the previous day’s newsletter. Net P/L figures are based on the $50,000 model account size. Changes to open positions since the previous report are listed in red text below.
Having trouble seeing the position summary graphic above? Click here to view it directly on your Internet browser instead.
Notes:
- Sold ALXN to lock in gains. Sold ARIA at break-even. CLR triggered the stop. Added to SWI and N.
Relative Strength Watchlist:
The Relative Strength (or RS) Watchlist makes it easy for subscribers to import data into their own scanning software, such as Tradestation, Interactive Brokers, and TC2000. The list is comprised of the strongest 100 (or so) stocks in the market over the past six to 12 months. The scan is based on the following criteria and is updated every Monday:
- Stock is in a well defined uptrend, trading above both the 50-day and 200-day moving averages, with the 50-day moving average above the 200-day moving average (both moving averages should be in an uptrend as well).
- Today’s close is less than 20% off the 52-week high
- Close is greater than $5.
- Volume is greater than 200,000 shares per day (using a 50-day volume moving average).
Click here to view this week’s Relative Strength Watchlist in excel
Click here to view this week’s Relative Strength Watchlist as a text file