Current signal generated on close of March 12.
Portfolio exposure can be anywhere from 30% to 100% long, depending on how open positions have held up.
Past signals:
- Buy signal generated on close of February 13
- Sell signal generated on close of February 3.
- Neutral signal generated on close of January 24.
- Buy signal generated on close of November 13
- Buy signal generated on close of September 9
- Neutral signal generated on close of August 15
- Buy signal generated on close of July 11
- Neutral signal generated on close of July 5
- Sell signal generated on close of June 24
today’s watchlist (potential trade entries):

Having trouble seeing the open positions graphic above? Click here to view it directly on your web browser instead.
Below is an overview of all open positions, as well as a report on all positions that were closed only since the previous day’s newsletter. Changes to open positions since the previous report are listed in pink shaded cells below. Be sure to read the Wagner Daily subscriber guide for important, automatic rules on trade entries and exits.
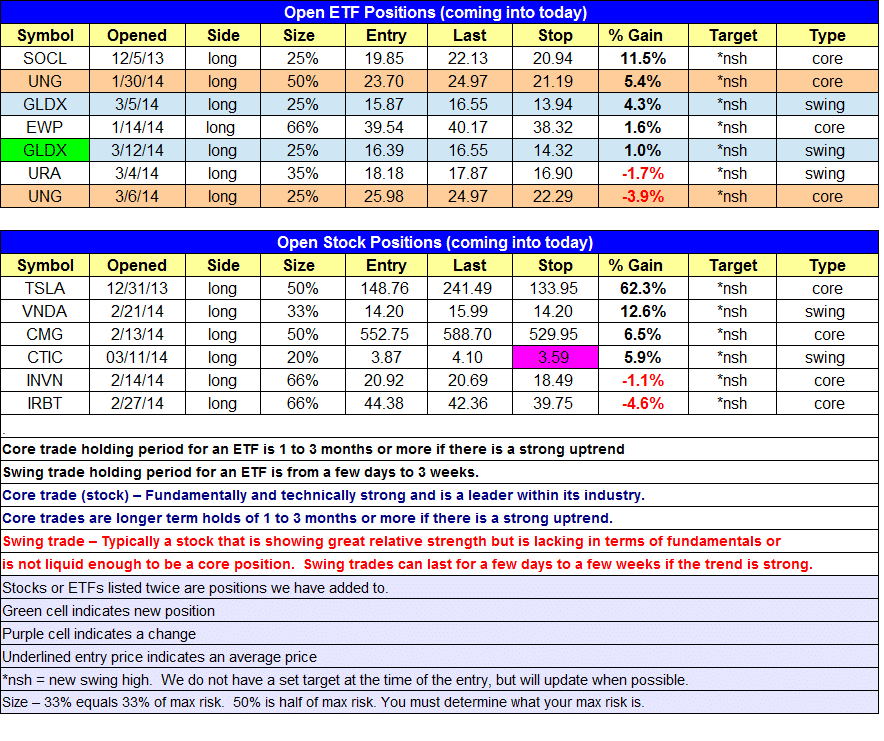
Having trouble seeing the open positions graphic above? Click here to view it directly on your web browser instead.
closed positions:
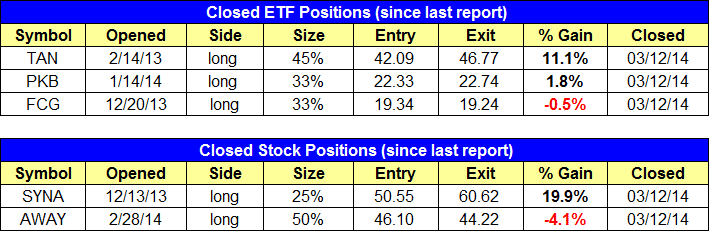
Having trouble seeing the closed positions graphic above? Click here to view it directly on your web browser instead.
ETF position notes:
- Note that we are entering $URA at market on the open, so the 5-minute rule will not apply. The 5-minute rule will also not apply to the buy limit order in $LIT.
stock position notes:
- Closed $SYNA for a 20% gain.
ETF, stock, and broad market commentary:
Despite a weak open, stocks reversed higher during the first two hours of trading and spent the rest of the day chopping in a tight range. All major averages closed with bullish reversal candles on the daily chart, and all but one (Dow Jones) closed in positive territory.
Turnover was lighter on both exchanges. However, the action was quite positive, as there was plenty of buying in leadership stocks during the morning session.
We have one new setup on today’s ETF watchlist, which is a pullback entry in Global X Uranium ETF ($URA) to the rising 20-day EMA.
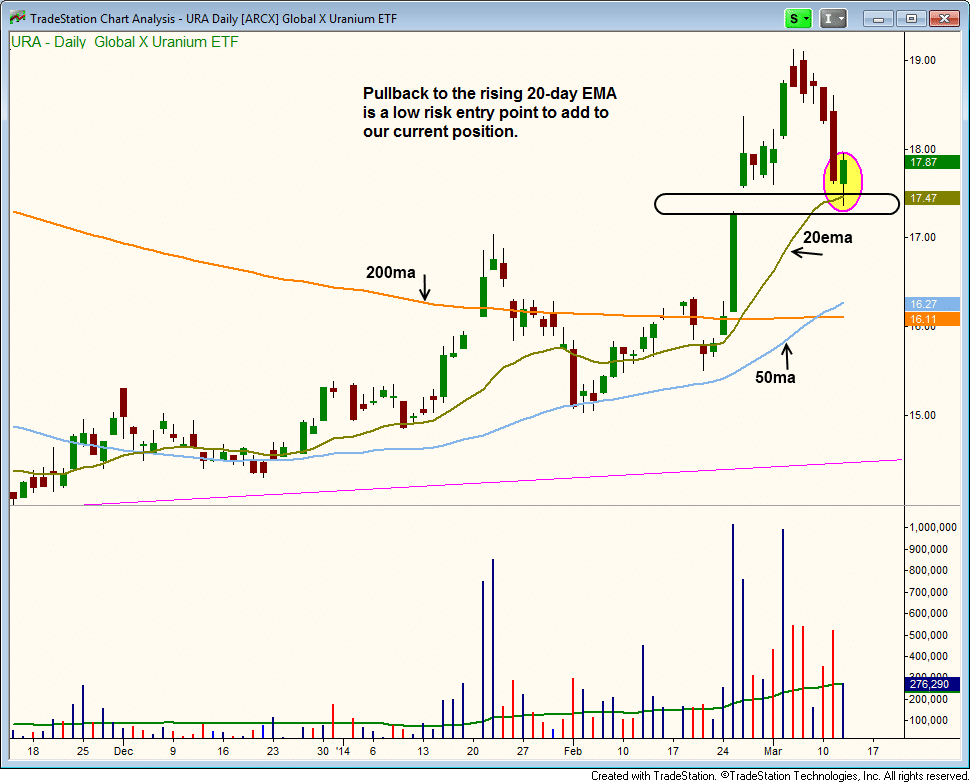
$URA followed through to the upside from our first buy point for a few days, but stalled out and pulled back into support. The $17 – $17.50 area looks to have a cluster of support from the 20-day EMA, a prior swing high, and the high of a big volume accumulation candle on 2/25.
The convincing advancing volume on the daily chart of $URA in 2014 tells us that once the price action settles down the uptrend should resume.
We are adding to our long position but for those who missed the first entry this is a low-risk buy point for the full position. Please see trade details above.
Although biotech stocks have taken a break, money has rotated into semiconductors, commodities, and transportation stocks.
The weekly chart of Dow Jones Transportation ETF ($IYT) below shows the bullish basing action followed by a higher volume advance above the 10-week MA last week.
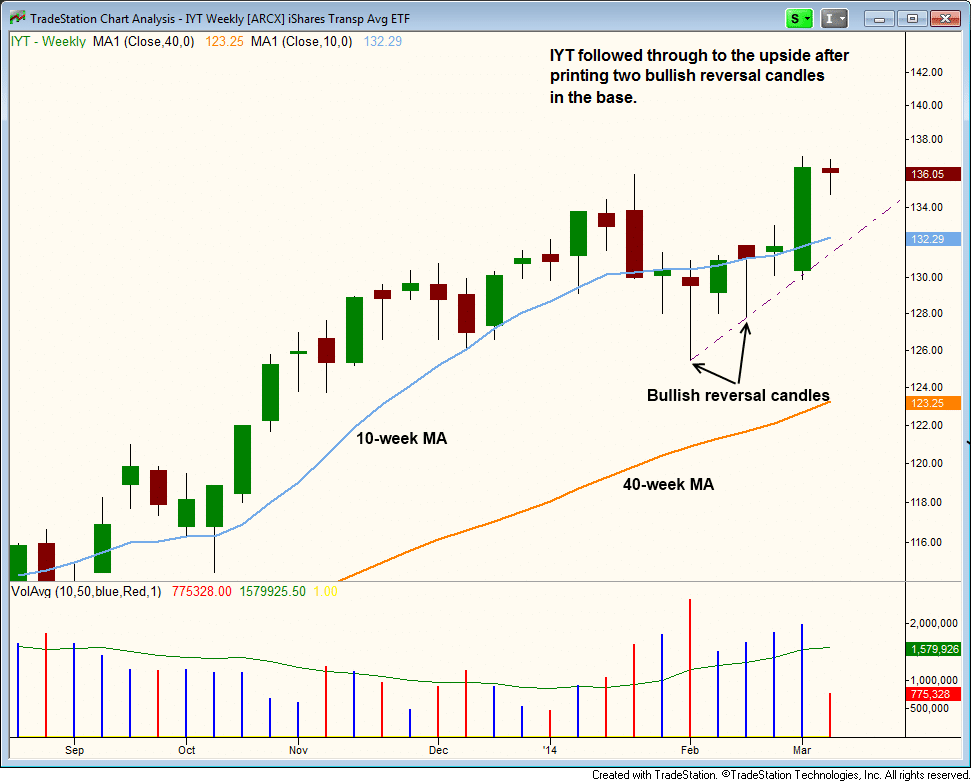
Notice how the bullish closes on the weekly chart are near the highs of each candle. Volume during the base was also bullish, with the biggest spike in volume coming on a bullish reversal candle in early February that undercut prior lows.
On the stock side, we have several new buy setups along with a buy limit order in $TSLA.
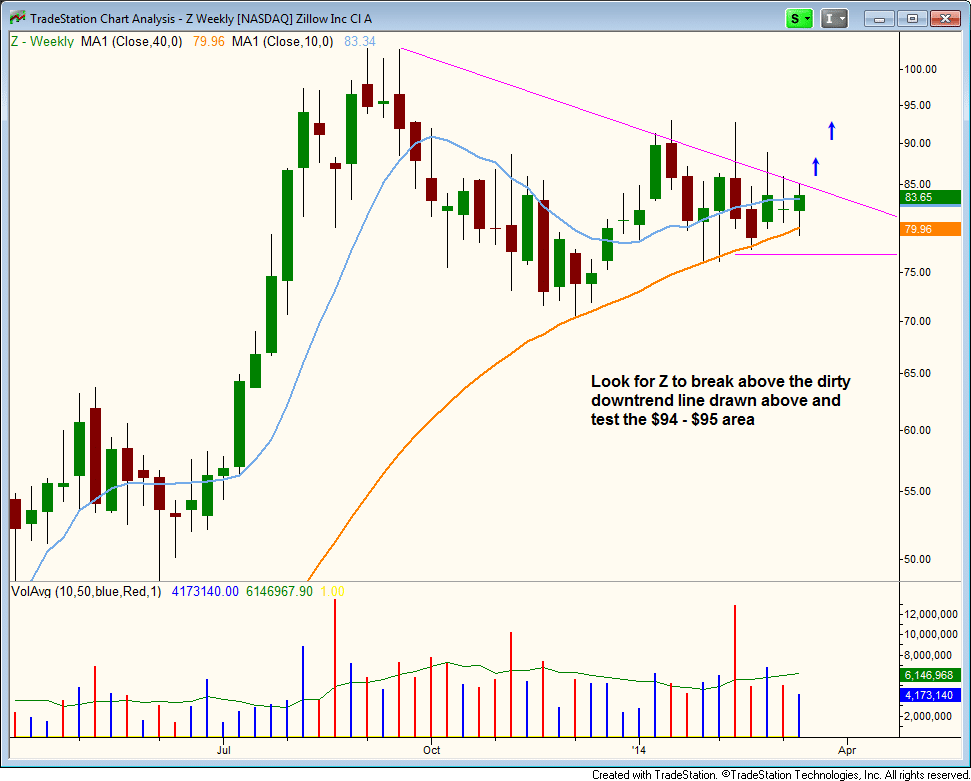
We like $Z as a potential core trade due to its strong earnings and current base that is holding at support from the 10 and 40-week MAs. We look for $Z to break the downtrend line and test the $94-$95 area. Depending on the price and volume action, we may attempt to add to the position.
$FENG and $QLYS are also strong setups. $FENG is an explosive IPO with a ton of potential. If it gets going it could turn into a nice trade.