Current signal generated on close of June 20
Past signals:
- Buy signal on the close of June 13
- Neutral signal on close of June 12
- Buy signal on the close of April 30
today’s watchlist (potential trade entries):

Having trouble seeing the open positions graphic above? Click here to view it directly on your web browser instead.
open positions:
Below is an overview of all open positions, as well as a report on all positions that were closed only since the previous day’s newsletter. Net P/L figures are based a $100,000 model portfolio. Changes to open positions since the previous report are listed in pink shaded cells below. Be sure to read the Wagner Daily subscriber guide for important, automatic rules on trade entries and exits.

Having trouble seeing the open positions graphic above? Click here to view it directly on your web browser instead.
closed positions:
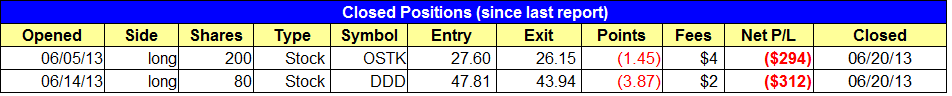
Having trouble seeing the closed positions graphic above? Click here to view it directly on your web browser instead.
ETF position notes:
- No setups triggered
stock position notes:
- Stops triggered in $DDD and $OSTK.
ETF, stock, and broad market commentary:
Following through on Wednesday’s late selloff, stocks were hit hard all session long with all major averages closing down at least 2.3% on the day. Total volume jumped by 39% on the NYSE and 23% on the NASDAQ, producing a second straight day of distribution for both the S&P 500 and NASDAQ.
Thursday’s bearish price and volume action did quite a bit of technical damage to the daily charts, as all major averages are now trading below the prior swing low and the 50-day MA, signaling the uptrend is in danger of reversing. Because the prior swing lows have been broken, the averages are no longer making higher swing lows, which forces our timing model back in to neutral mode (we have a simple rule in place where can’t establish new longs when the market is breakding down and setting lower highs and lower lows). Without a swing low in place, adding long exposure is not an option, especially when the volume patterns are once again turning negative on the NYSE and NASDAQ.


With the market now trading below recent swing lows, the bottoming process will start all over again for us, as we now must wait for a swing low to hold for at least four days in a major average before our timing model can produce a buy signal. The mechanical portion of our timing model will produce a buy signal once an average has held a swing low for four days and then prints a big accumulation day, gaining at least 1.5% on a pick up in volume. So to be clear, there are two parts to the mechanical buy signal in our model:
- A major average must hold a swing low for four days
- There must be a big volume accumulation day, with a 1.5% gain on higher volume in a major average (this can happen on day four).
We are not looking to establish new positions in ETFs or stocks right now. Depending on how the market reacts next week, we could begin to establish short positions if the leading stocks also begin to breakdown.
If strong basing patterns like $LNKD can’t hold on to swing lows, then we have to assume that the market may need several more weeks of base building before a new rally can emerge.

False breakouts can be a good thing, but they should not break down much below the 20-day EMA before reversing to close near the highs of the day. $OCN’s selloff was not the type of false breakout we like to see, as it basically gapped down below the 20-day EMA and sold off all session long, closing near the lows of the day on heavy volume. If it doesn’t bounce back tomorrow we will probably see a quick test of the 50-day MA, meaning that this pattern will need a few more weeks of basing action before it can head higher.

If $KORS can hold the 50-day MA for the next few days that would be a very bullish sign. A breakdown below the 50-day MA and the prior swing lows could lead to a test of the 200-day MA, and a deeper base, requiring more time for consolidation.

With the market timing model in neutral, our short-term plan is to wait for the market to gain some traction before establishing new longs. If leadership does not hold up and the averages fail to reclaim the 50-day MA, then we may take on some short exposure.
If you have just signed up with our service during the past week or two, you have seen very few bullish patterns following through. This is a function of the market. Bullish patterns work when conditions are healthy and fail when conditions turn sour. When conditions are less than ideal, we prefer to play defense and sit mostly in cash until the next move is clear (long or short).
We updated the Relative Strength Combo list this evening. Please note the new features on that list in the RS Combo guide below.