Buy
– Signal generated on the close of April 30
Due to the recent distribution in the Nasdaq, we are no longer in confirmed buy mode (now is not the time to step on the gas). We remain in buy mode, but if market conditions continue to deteriorate the timing model will shift to sell mode.
today’s watchlist (potential trade entries):

Having trouble seeing the open positions graphic above? Click here to view it directly on your web browser instead.
open positions:
Below is an overview of all open positions, as well as a report on all positions that were closed only since the previous day’s newsletter. Net P/L figures are based a $100,000 model portfolio. Changes to open positions since the previous report are listed in pink shaded cells below. Be sure to read the Wagner Daily subscriber guide for important, automatic rules on trade entries and exits.

Having trouble seeing the open positions graphic above? Click here to view it directly on your web browser instead.
closed positions:

Having trouble seeing the closed positions graphic above? Click here to view it directly on your web browser instead.
ETF position notes:
- No trades were made.
stock position notes:
- Note the reduced share size in $OSTK.
ETF, stock, and broad market commentary:
Stocks sold off on heavier volume yesterday, logging yet another bearish distribution day on both the S&P 500 and NASDAQ Composite. We already know that the market is in a corrective phase, as we have been in chop mode for a few weeks now. So the big question is, just how far off the highs will the market correct? If leading stocks continue to hold above the 50-day MA, then we would expect the correction to be shallow and no more than 4-6% off recent highs. However, if the broad market averages break down below the 50-day MA and leading stocks follow, then a deeper correction could emerge. As always, we want to avoid making any predictions and take it one day at a time, but for now our market timing model remains in buy mode.
The negative volume pattern in the market is still a concern. The S&P and NASDAQ sold off on higher volume in late May/early June, then bounced higher on light volume on June 6 & 7. This was followed by heavy volume selling once again on June 11. We will continue to lay low for the most part until the volume patterns improve.
Here are a few ETFs that are holding up well as of late (aside from $TAN and $SMH).
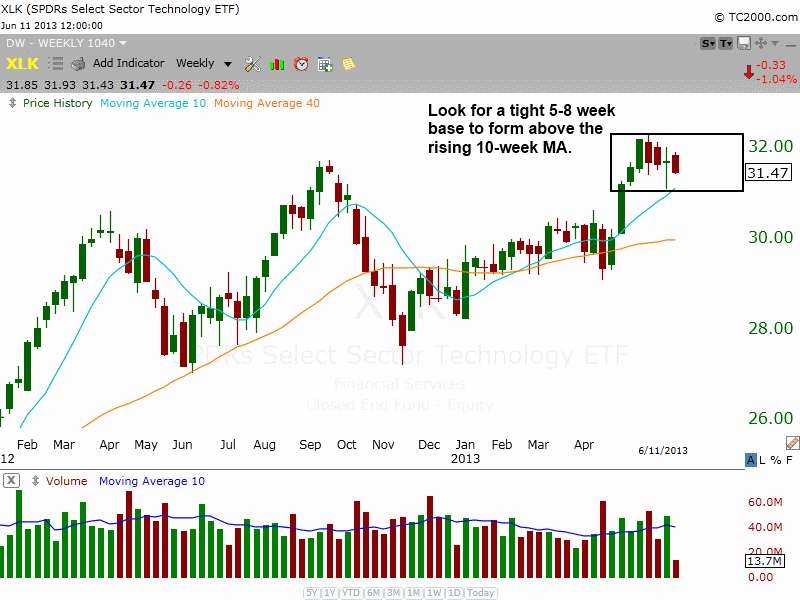
After breaking about above $30, Technology Select Sector SPDR ($XLK) stalled at the prior highs of 2012 a few weeks ago. Since then is has consolidated in a tight, sideways range above the rising 10-week MA. $XLK will need a few more weeks of basing aciton (as do most ETF/stocks), so the chart is not actionable.

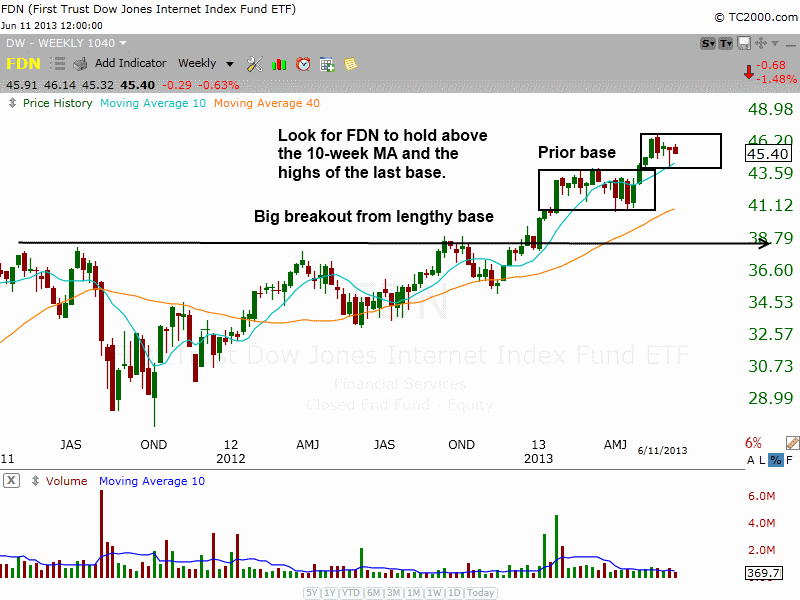
First Trust Dow Jones Internet Index ($FDN) is also trading in a tight range above the rising 10-day MA. $FDN should hold above the highs of the prior base over the next few weeks. A breakdown below $43 would result in a deeper correction and more time to create a valid basing pattern.

Our scans have not produced much in the way of low risk buy entries on the ETF side the past few weeks, so patience is key right now as the market consolidates.
On the stock side, we haven’t seen much follow through in recent breakouts and that is why we have been laying low for the most part. Experienced traders may take a few shots on the long side with small size, but one should not be putting big money to work when the volume patterns are bearish.
Due to the excessive distribution days in the market, we reduced our share size in the $OSTK buy setup. We are now only risking about 1/4 of 1%.
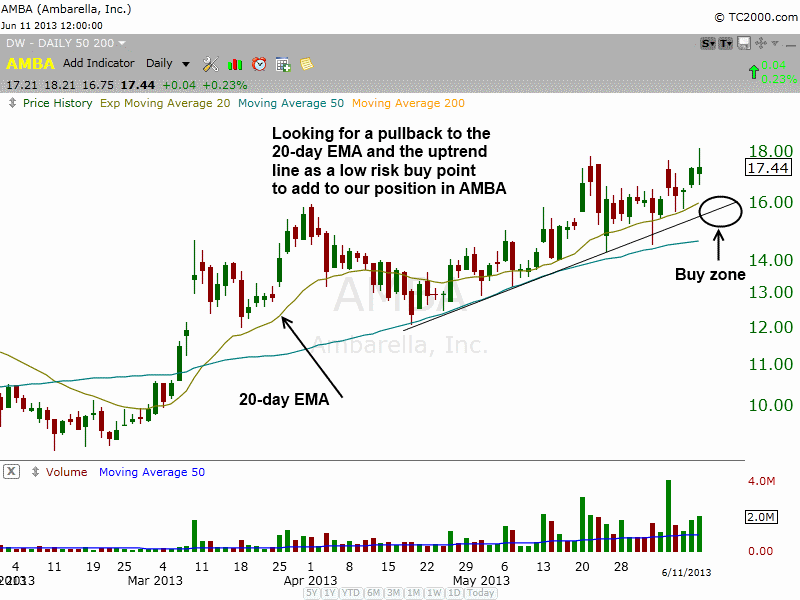
An orderly pullback to the 20-day EMA and the uptrend line around 15.50 – 16.00 could provide us with a low risk buy point to add to our existing long position in $AMBA.

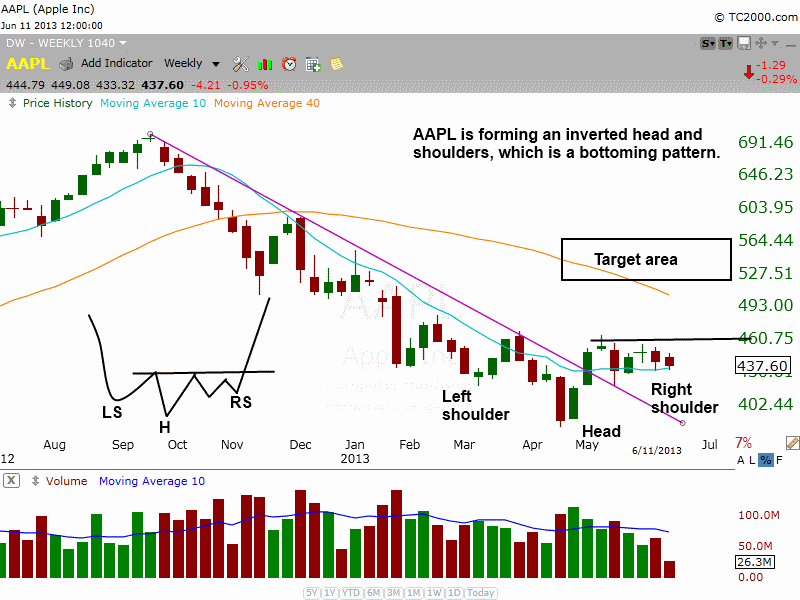
$AAPL is forming an inverted head and shoulders pattern on the weekly chart below, which is a bullish, bottoming pattern. We do not plan on trading $AAPL, we are just pointing out a bullish pattern (we focus on stocks trading near 52-week highs).

The price action in the right shoulder should not dip much below the low of the left shoulder. A breakout above $465 is the obvious buy signal, but those who are following closely might be able to grab a lower entry point on the break of the daily downtrend line around $450. The target for the trade would be around the 540-560 area.