Buy
– Signal generated on the close of April 30 (click here for more details)
today’s watchlist (potential trade entries):

Having trouble seeing the open positions graphic above? Click here to view it directly on your web browser instead.
open positions:
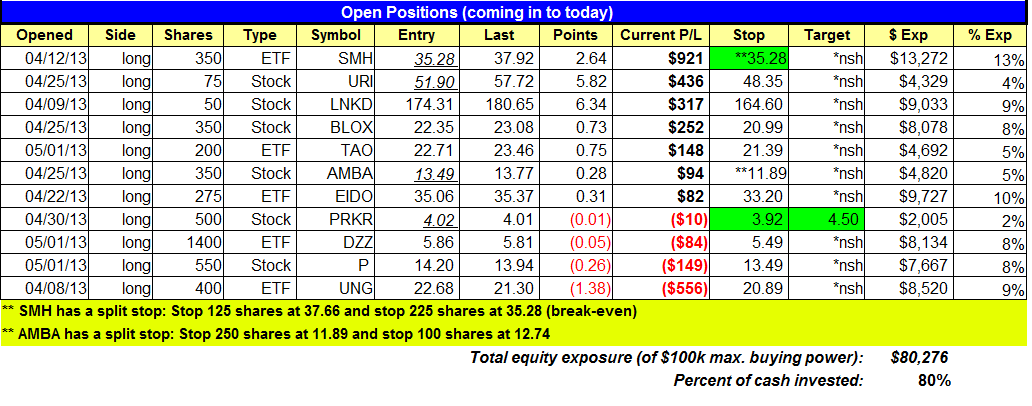
Below is an overview of all open positions, as well as a report on all positions that were closed only since the previous day’s newsletter. Net P/L figures are based a $100,000 model portfolio. Changes to open positions since the previous report are listed in pink shaded cells below. Be sure to read the Wagner Daily subscriber guide for important, automatic rules on trade entries and exits.
Having trouble seeing the open positions graphic above? Click here to view it directly on your web browser instead.
closed positions:

Having trouble seeing the closed positions graphic above? Click here to view it directly on your web browser instead.
ETF position notes:
- Note the split stop in $SMH.
stock position notes:
- Note the new target and stop price in $PRKR. $PRKR reports earnings after the close on May 9, so we want to sell into strength IF we get a pop ahead of earnings.
ETF, stock, and broad market commentary:
The market continued its win streak on Tuesday, posting solid gains in the S&P 500, mid-cap S&P 400, and small cap Russell 2000. However, there was some divergence with the Nasdaq Composite only gaining 0.1%, and the Nasdaq 100 closing in negative territory, down -0.1%. The higher volume and stalling action in the Nasdaq suggests that there was a bit of bearish churning (selling at the highs).
There was some selling in a few names off our internal watchlist, but for the most part it was contained. $SCTY, $TSLA, $GNRC, $WDAY, $FSLR, and a handful of small cap biotech stocks took a hit on higher volume. Overall, conditions remain bullish, but many stocks are extended in the short-term and may need a week or two of consolidation to provide us with low risk buy points.
After a strong rally off the 50-day MA, Merrill Lynch Semiconductors HOLDRS ETF ($SMH) has stalled out at the $38 level the past few days. Whenever a stock or ETF breaks out and runs higher with very little rest, if possible, we like to draw a steep uptrend line to give us an idea of where potential intraday pullbacks should find support. A trend line becomes valid when there are at least 1 or 2 touches after the first two points have been established. The longer the trend line holds, the more valid it becomes.
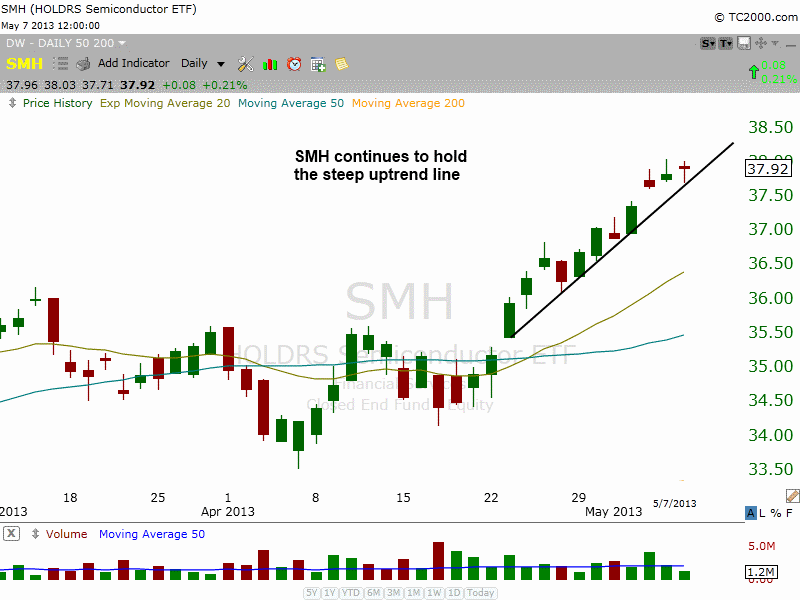
When the price action bolts higher without looking back, we usually see the entire advance holding above the rising 20-period EMA on the hourly chart. This 20-day EMA will often coincide with a steep uptrend line on the daily chart, as it has with $SMH here.
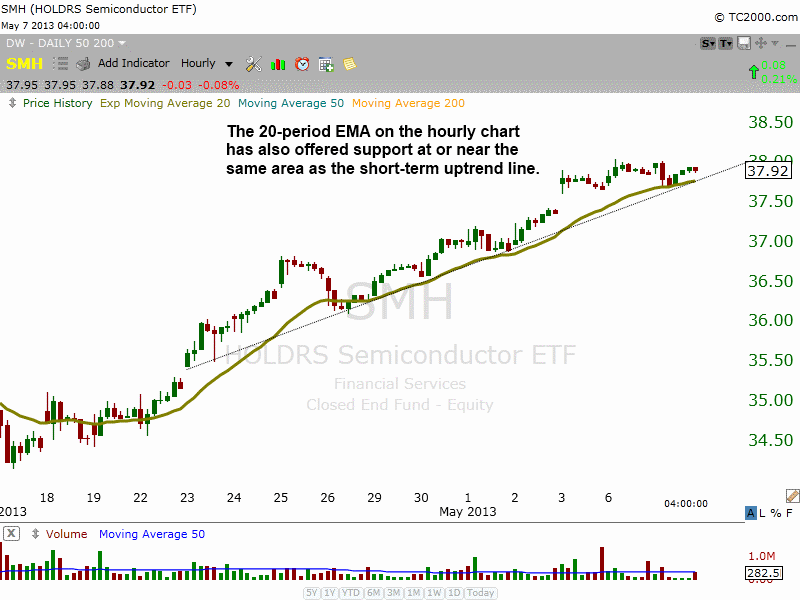
We are raising the stop on 1/3 of our position in $SMH. The new stop is below Tuesday’s low, which will put the price action below the steep uptrend line on the daily and the 20-period EMA on the hourly. We plan to keep a break-even stop on the remaining shares.
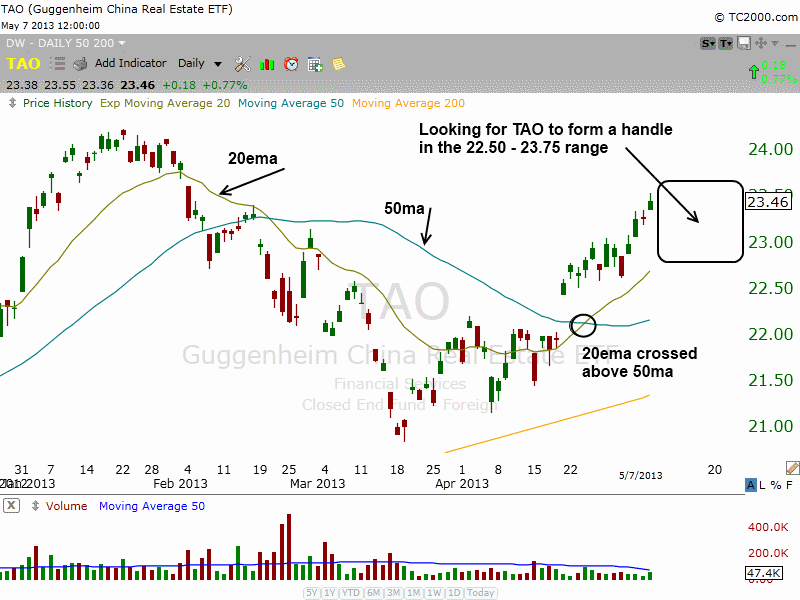
Guggenheim China Real Estate ETF ($TAO), continue to march higher, and is approaching resistance from the prior swing high in January around the $23.75 – $24 area. Although it may sound strange, we’d prefer the price action to stop going higher within the next few days and form a tight range over the two or three weeks. This type of short-term consolidation is known as a “handle”. A well formed handle allows the price action to coil up while shaking out the weak hands, and should eventually lead to a breakout that propels the price action above the highs of the left hand side of the base. We’d like to see the handle hold above or near the rising 20-day EMA.
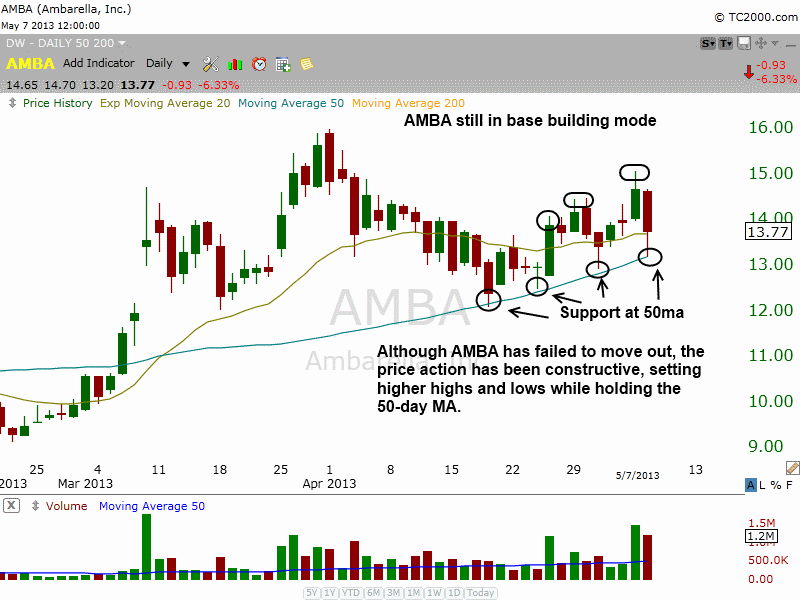
$AMBA pulled back in on Tuesday, after failing to follow through on Monday’s strong price and volume action. However, we continue to see support step in at the 50-day MA, which is a bullish sign. It still looks as if $AMBA is under heavy accumulation, as it has formed a series of higher highs and lows with a bullish volume pattern. The setup may need another week or two to develop.
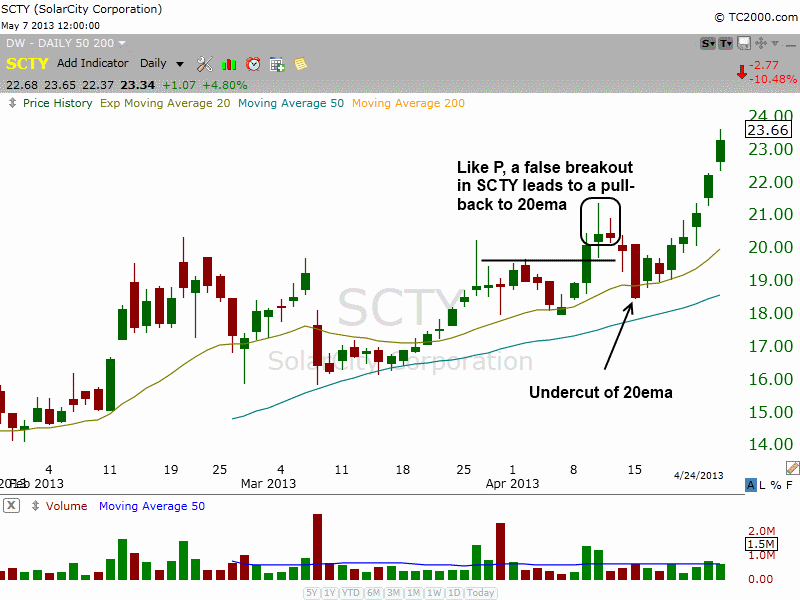
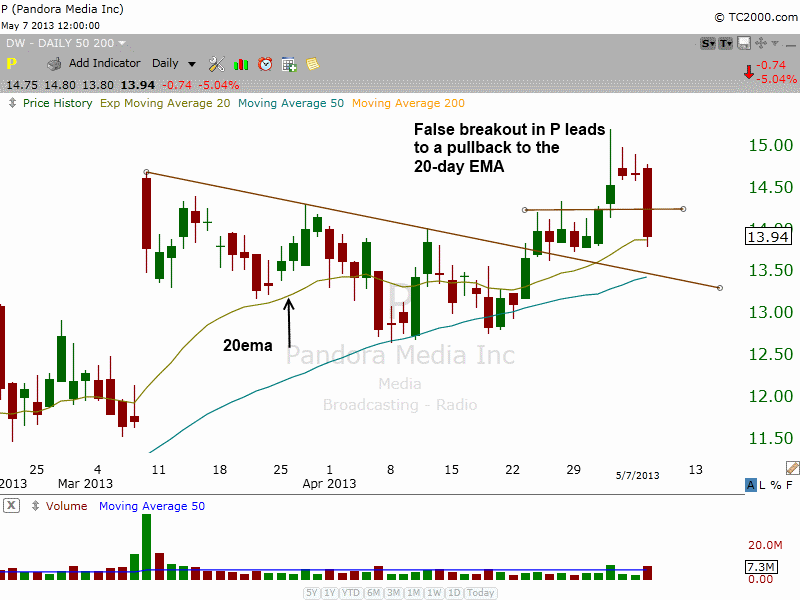
$P had a rough day, selling off 5% on higher volume to the 20-day EMA. However, the setup is not dead. If the price action can hold up here for a few days and form a tight range, then we could see $P recover and breakout to new highs sometime next week. We say this because that is exactly what $SCTY did in mid-April. Note the false breakout on 4/10, followed by a sharp one day pullback on 4/15. After a few days of tight price action, buyers returned, lifting $SCTY to new highs in six days.
Like $SCTY, after a false breakout to new highs, $P sold off sharply in one session to the 20-day EMA. The question now is will the price action tighten up during the next few days or roll over?
relative strength combo watchlist:
Our Relative Strength Combo Watchlist makes it easy for subscribers to import data into their own scanning software, such as Tradestation, Interactive Brokers, and TC2000. This list is comprised of the strongest stocks (technically and fundamentally) in the market over the past six to 12 months. The scan is updated every Sunday, and this week’s RS Combo Watchlist can be downloaded by logging in to the Members Area of our web site.