Current signal generated on close of July 11
Past signals:
- Neutral signal generated on close of July 5
- Sell signal generated on close of June 24
today’s watchlist (potential trade entries):

Having trouble seeing the open positions graphic above? Click here to view it directly on your web browser instead.
open positions:
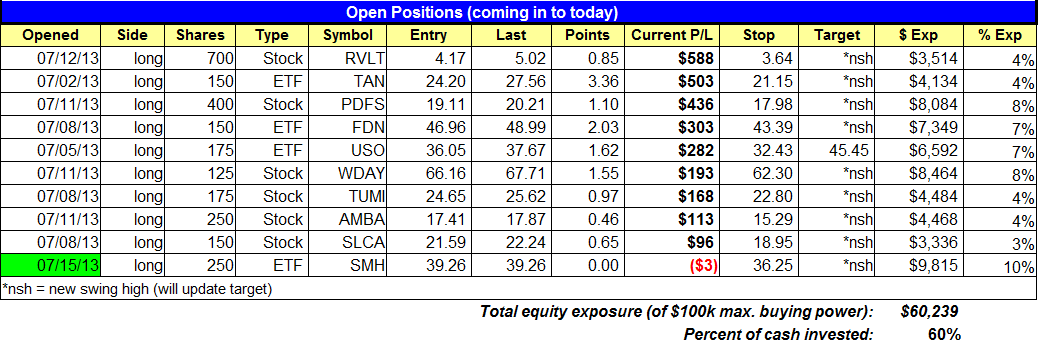
Below is an overview of all open positions, as well as a report on all positions that were closed only since the previous day’s newsletter. Net P/L figures are based a $100,000 model portfolio. Changes to open positions since the previous report are listed in pink shaded cells below. Be sure to read the Wagner Daily subscriber guide for important, automatic rules on trade entries and exits.

Having trouble seeing the open positions graphic above? Click here to view it directly on your web browser instead.
closed positions:

Having trouble seeing the closed positions graphic above? Click here to view it directly on your web browser instead.
ETF position notes:
- Please note that we are buying $IHI “at the market” on Tuesday’s open, just like we bought $SMH yesterday. $SMH buy entry triggered yesterday on the open.
stock position notes:
- Cancelled the $MNKD setup (5-minute high was more than 1.3% above trigger). $AWAY stop triggered and we are out of the last 100 shares with a small loss. Total gain on the trade was a positive scratch at around + $90.
ETF, stock, and broad market commentary:
Broad market averages basically chopped around most of the day, with all averages closing in positive territory, but with small gains. The small cap Russell 2000 outperformed, gaining 0.6% on the day against a 0.1% gain in the S&P 500.
With our timing model in buy mode, we continue to search for low risk breakout or pullback setups. When the market is extended, some traders have a tough time buying stocks out of fear that their entry will “call the top”. This is a perfectly natural thought; however, most of the time, good trading decisions go against human nature. That is why following a system and doing the right thing can be so tough. The way we deal with a strong market is simply to focus on indidual setups and position management.
$SMH was added to the portfolio yesterday and we have one new buy setup on today’s watchlist in iShares Dow Jones US Medical Devices ($IHI).
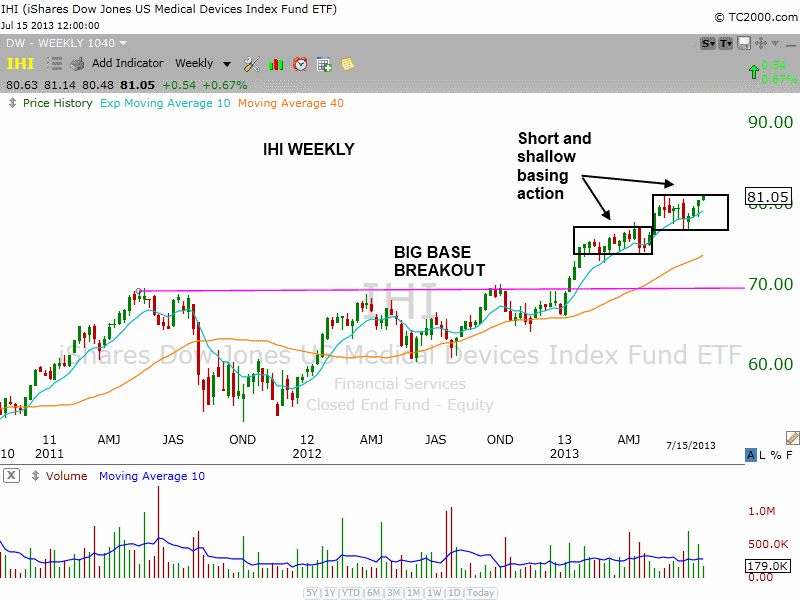
$IHI broke out from a two year long consolidation at the beginning of the year. After stalling out at $76 and chopping around for a few months, $IHI has formed a tight base on top of the last base during the past 8-weeks. Note the strong support at the 10-week MA, which is where the past two consolidations have found support. We often see short consolidations form after a stock or ETF breaks out from a long base. The weekly chart below is a good example of this:

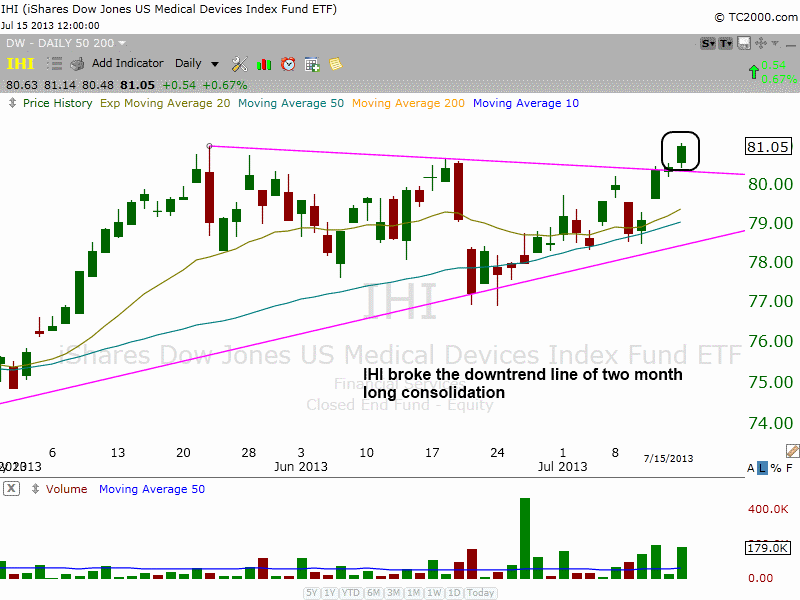
On the daily chart, $IHI has broken the downtrend line of the current base after “shaking out the longs” in mid-June, on a dip below the 50-day MA. Trade details can be found in the watchlist section above. We plan to add to the position on a confirmed breakout above the range highs.

Because $MNKD triggered our buy entry within the first five minutes of trading, the 5-minute rule applied. As per the rule, if a stock rallies more than 1.3% above our trigger by 9:35 the setup in automatically canceled. The 1.3% rule is to protect us from being filled at market on a big gap up. Sometimes it prevents us from trading a winner, but more often than not, the 5-minute rule has done its job through the years. If you are still long $MNKD that is great. Continue to hold the position using the stop from Monday’s report. The target area is around $9 to $9.50.
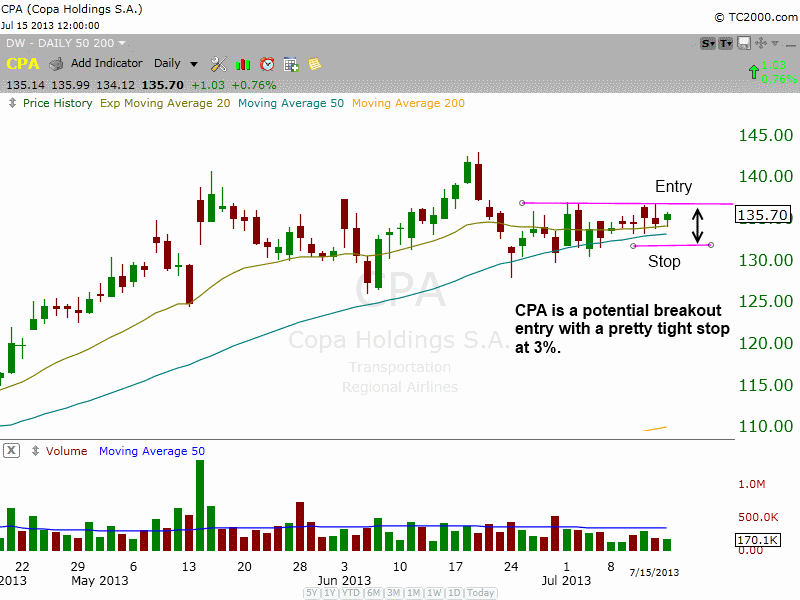
We have one new buy setup on the stock side today in Copa Holdings ($CPA). After a false breakout to new highs in mid-June, the price action pulled back to and found support at the 50-day MA, where it has been trading in a tight range over the past few weeks. Our buy entry is over the highs of the current tight range, and the stop is just below the 50-day MA. We are looking for a move to new highs as our target, somewhere around the $155-160 area.
