Sell Mode
– Timing model generated sell signal on close of April 3 (click here for more details)
Note the position sizing in $VXZ. The size is now based on a $100,000 portfolio. A typical full sized loss should now be around 1% of account equity or $1,000. A half position is 0.5% of account equity or $500.
today’s watchlist (potential trade entries):

Having trouble seeing the open positions graphic above? Click here to view it directly on your web browser instead.
open positions:
Below is an overview of all open positions, as well as a report on all positions that were closed only since the previous day’s newsletter. Net P/L figures are based on two separate $50,000 model portfolios (one for ETFs and one for stocks). Changes to open positions since the previous report are listed in pink shaded cells below. Be sure to read the Wagner Daily subscriber guide for important, automatic rules on trade entries and exits.

Having trouble seeing the open positions graphic above? Click here to view it directly on your web browser instead.
closed positions:

Having trouble seeing the closed positions graphic above? Click here to view it directly on your web browser instead.
ETF position notes:
- $VXZ buy stop triggered and we are long.
stock position notes:
- No trades were made.
ETF, stock, and broad market commentary:
Stocks responded favorably on Thursday by failing to follow through to the downside after Wednesday’s heavy volume distribution day. The daily and weekly charts of the S&P 500 and Nasdaq Composite remain bullish, as both averages are not in immediate danger of breaking the 50-day MA. The small cap Russell 2000 undercut the 50-day MA on Wednesday and closed back above the 50-day the following day. In a bull market we want to see all major averages holding above the 50-day MA, so we must keep an eye on the Russell 2000 next week. If the Russell 2000 were to break the 50-day and hold, then it would obviously not be a good sign for the current rally, which is already under pressure from 5 distribution days and leaders selling off.
When our timing model shifts to sell mode we are basically saying that the market is vulnerable to a sharp selloff. At this point, one should consider taking profits on extended positions (that show signs of weakness) or trail tight stops to protect gains. If your stock or ETF does not budge while the market is under distribution, then by all means do not sell, as you may be holding on to a position that is a true market leader.
We scanned a list of country ETFs to locate strong patterns forming near 52-week highs. Here are a few names off that list:
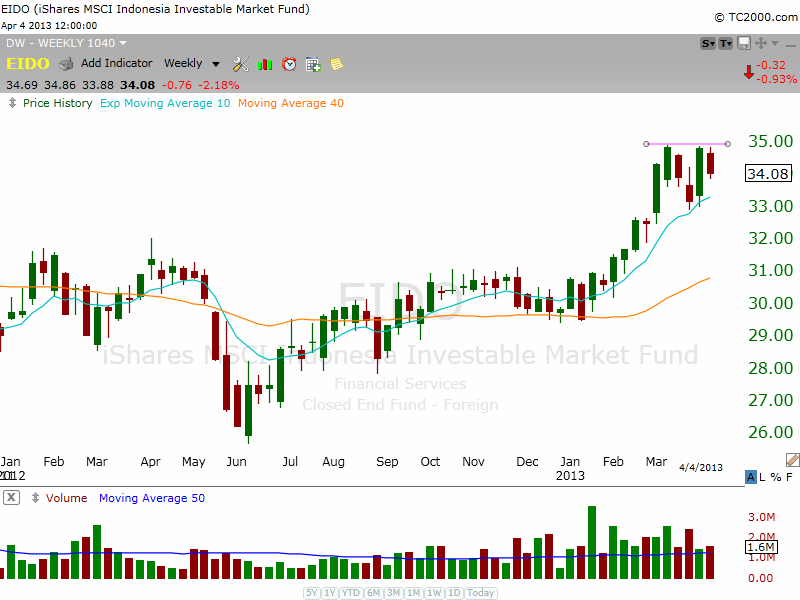
iShares MSCI Indonesia ($EIDO) is consolidating near the highs of 2011, forming a tight base above the rising 10-week moving average. Note the separation in the 10-week MA from the 40-week MA after a strong breakout from a base at $31 earlier this year. The pattern is not buyable right now, but could be ready in the next few weeks if it can tighten up on the daily chart and provide us with a low risk entry point.

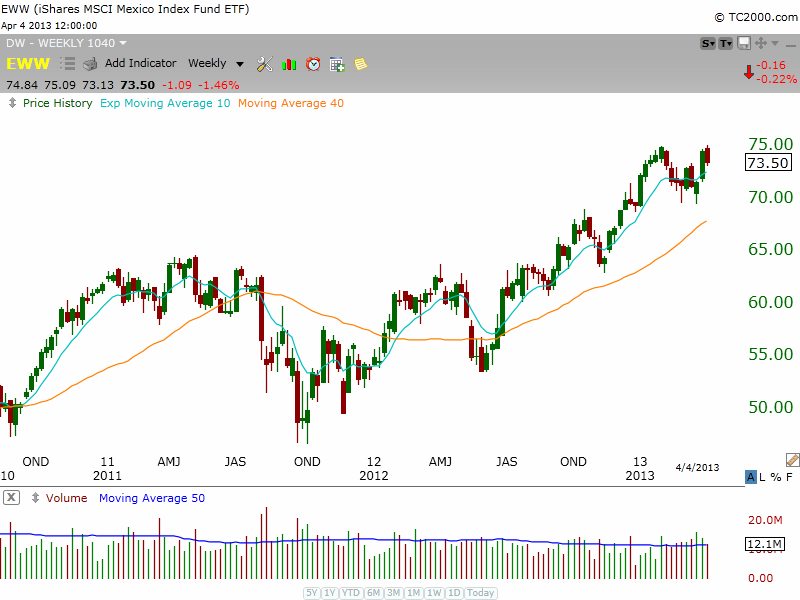
iShares MSCI Mexico ($EWW) recently broken out to new all time highs, clearing the highs of 2007 and 2011 earlier this year. The 20-day EMA has crossed above the 50-day MA, and should now be ready to form a tight handle below the highs of the current base over the next few weeks. We’d like to see the action hold above the 50-day MA as it continues to consolidate.

We are also monitoring Ishares Msci Turkey ($TUR) and iShares MSCI Singapore ($EWS) for entry points within the next week or two and will potentially cover these charts next week.
On the stock side, we continue to hold PRLB long. Hopefully it can hold the 50-day MA while the market does its thing and eventually breakout when conditions improve.
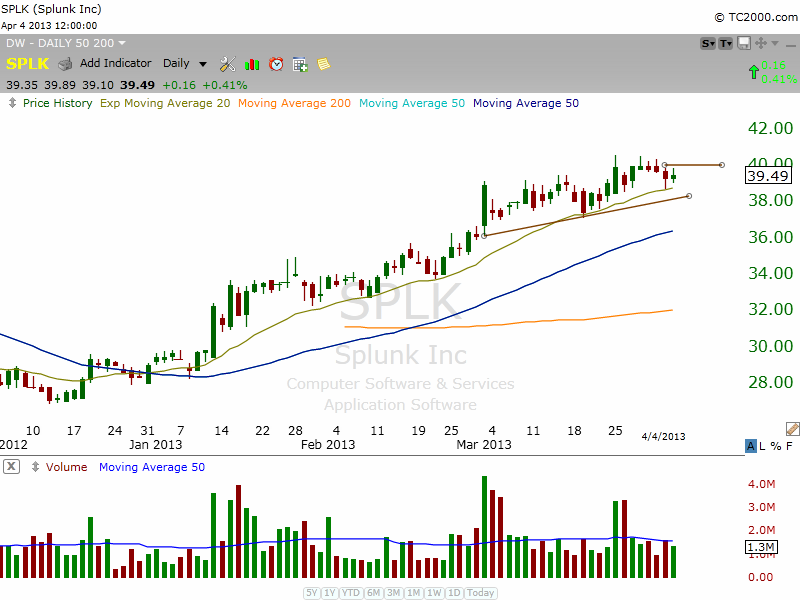
Along with a few charts posted yesterday, we also like Splunk Inc – $SPLK. If the market can find some traction during the next few days, then $SPLK might present us with a low risk entry point around $40.

Note the tight price action within the base that has held above a rising 20-day EMA. This is not an official setup today but could be on the official watchlist early next week. The stop on any entry should be place beneath the 4/3 low minus 20 cents.
With obvious leadership stocks taking a break, new leaders will have to emerge if this market is to hold up and push higher. We are not operating with the expectation that the market will fail, as there is still plenty of upside momentum in this rally, with all major averages still trading above rising 50-day MAs.
relative strength combo watchlist:
Our Relative Strength Combo Watchlist makes it easy for subscribers to import data into their own scanning software, such as Tradestation, Interactive Brokers, and TC2000. This list is comprised of the strongest stocks (technically and fundamentally) in the market over the past six to 12 months. The scan is updated every Sunday, and this week’s RS Combo Watchlist can be downloaded by logging in to the Members Area of our web site.