Buy Mode
– Timing model generated buy signal on close of March 5 (click here for more details)
today’s watchlist (potential trade entries):

Having trouble seeing the open positions graphic above? Click here to view it directly on your web browser instead.
open positions:
Below is an overview of all open positions, as well as a report on all positions that were closed only since the previous day’s newsletter. Net P/L figures are based on two separate $50,000 model portfolios (one for ETFs and one for stocks). Changes to open positions since the previous report are listed in pink shaded cells below. Be sure to read the Wagner Daily subscriber guide for important, automatic rules on trade entries and exits.

Having trouble seeing the open positions graphic above? Click here to view it directly on your web browser instead.
closed positions:
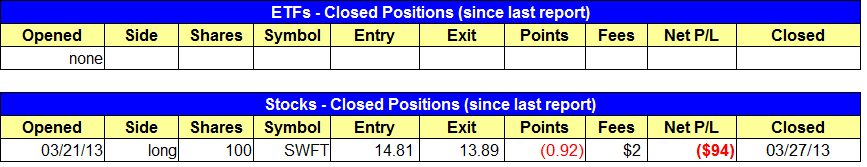
Having trouble seeing the closed positions graphic above? Click here to view it directly on your web browser instead.
ETF position notes:
- No trades were made. We removed $KBE from the watchlist, and although $KBE remains a solid setup we prefer to focus on the emerging semiconductor sector.
stock position notes:
- Stopped out of $SWFT. $PRLB long entry triggered.
ETF, stock, and broad market commentary:
Stocks got off to a rough start yesterday morning, as the major indices gapped down to open below their prior day’s lows. However, the market impressively reversed its early weakness. By the closing bell, the NASDAQ Composite managed to gain 0.1%, while the S&P 500 trimmed its loss to just 0.1%. The Dow Jones Industrial Average recovered from a 0.8% loss to finish just 0.2% lower. Total volume in both exchanges was roughly on par with the previous day’s levels. Overall, yesterday’s price action was rather bullish, as the sharp opening gap down was the perfect opportunity for the bears to pounce, but the bulls stepped in to provide support instead.
Throughout the entire rally of 2013, the NASDAQ has been lagging behind, while the Dow and other large-cap stocks have been showing leadership. However, over the past week, we have been spotting what may be early signs of institutional sector rotation out of the Dow and into the NASDAQ. Yesterday’s relative strength exhibited by the NASDAQ was just one instance of the changing of guards that may be taking place.
Within the NASDAQ, one industry sector that appears poised to make a substantial intermediate-term move to the upside is semiconductors. Specifically, we like the bullish setup that Market Vectors Semiconductor ETF ($SMH) is now presenting. For starters, take a look at the long-term monthly chart of $SMH below:

Many swing traders focus primarily on the daily chart interval, while ignoring longer-term charts such as the monthly. This is a mistake because it prevents traders from seeing the “big picture” of what is really happening within specific industry sectors. In the case of $SMH, we see that the ETF has just broken out above resistance of a downtrend has been in place since 2004. But this would not be apparent without looking at the monthly chart timeframe.
Obviously, the monthly chart interval is NOT used for determining specific entry and exit points for actual swing trade setups. When one bar equals an entire month of price action, determining where to buy or sell based on that chart would be impossible for short-term traders. As such, when we identify something we like on a longer-term chart, such as this $SMH pattern, we then drill down to the shorter-term weekly and daily chart intervals. The weekly chart of $SMH is shown below:

Notice that SMH has been oscillating in a wide range since late 2010. However, the price action has tightened up dramatically over the past eight weeks. Combined with the breakout above the nine-year downtrend line, this price consolidation and base building is bullish. Furthermore, notice that the 10-week moving average (teal line) is acting as support AND has pulled away from the 40 -eek moving average, which is now sloping higher as well. These are all bullish signals that typically precede big “stealth” breakouts that the average retail trader will not see until it becomes quite obvious.
Based on the monthly and weekly chart patterns above, $SMH has been added to today’s watchlist as an “official” buy setup. Our trigger price for buy entry is just above yesterday’s high, while the initial protective stop is below the low of the consolidation from late February. Note that our initial entry into this ETF, if it triggers, will be a partial position. “Starter positions” enable us to see how the stock or ETF acts, without much initial risk, and we then add to the position when the price confirms by either breaking out to new highs (or gives us some other type of low-risk buy entry). A starter position is like dipping your toe in the water before jumping into the ocean.
We stopped out of $SWFT yesterday, but the price action reversed nicely and closed with a bullish reversal candle, which gives a low-risk re-entry point above Wednesday’s high.

We can’t be afraid to re-enter a stock/ETF that we recently stopped out of IF the setup is still intact. If $SWFT stopped us out but closed at the lows of the day (down 4%), then there would be no reason to re-enter. There is a big difference between revenge trading (getting back in when there is no buy signal) and re-entering a solid setup.
$HOV is a new setup on today’s list which we like on a pullback off the 50-day MA. We are going with $HOV (rather than $PHM or $DHI) because it has the most explosive potential in the group. We already own some of the slower moving $ITB on the ETF side, so adding $HOV should give the portfolio a little more pop. We are also adding to our existing position in $DK on a move above the two-day high.
Although we pointed out the head and shoulders pattern of PowerShares Nasdaq 100 Index ($QQQ) in this past Monday’s newsletter, we also said the bearish pattern was only valid for short selling entry IF $QQQ fell below both its 50-day MA and prior swing low. If that does not happen, and $QQQ manages to breakout above its recent highs instead (the high of its right shoulder), the pattern will become a failed head and shoulders. When a head and shoulders pattern fails, the breakout to the upside is usually explosive because the bears who were betting on a move lower become forced to cover their short positions.
We see no reason to sit in cash with the market in a clear uptrend and new setups emerging in leadership stocks. We must always trade what we see, not what we think.
Note: The US stock market will be closed on Friday, March 29, so we will not publish a report on Thursday night (for Friday). Normal publication will resume on Sunday night for Monday, April 1. Have a Happy Holiday Weekend!
relative strength combo watchlist:
Our Relative Strength Combo Watchlist makes it easy for subscribers to import data into their own scanning software, such as Tradestation, Interactive Brokers, and TC2000. This list is comprised of the strongest stocks (technically and fundamentally) in the market over the past six to 12 months. The scan is updated every Sunday, and this week’s RS Combo Watchlist can be downloaded by logging in to the Members Area of our web site.