Neutral
– Timing model is at neutral as of the close of April 9 (see opening paragraph below). (click here for more details)
today’s watchlist (potential trade entries):

Having trouble seeing the open positions graphic above? Click here to view it directly on your web browser instead.
open positions:
Below is an overview of all open positions, as well as a report on all positions that were closed only since the previous day’s newsletter. Net P/L figures are based on two separate $50,000 model portfolios (one for ETFs and one for stocks). Changes to open positions since the previous report are listed in pink shaded cells below. Be sure to read the Wagner Daily subscriber guide for important, automatic rules on trade entries and exits.

Having trouble seeing the open positions graphic above? Click here to view it directly on your web browser instead.
closed positions:

Having trouble seeing the closed positions graphic above? Click here to view it directly on your web browser instead.
ETF position notes:
- No trades were made. We cancelled the $VNM trade for now, but continue to monitor the action for a buy point.
stock position notes:
- $LNKD and $CLDX buy stops triggered.
ETF, stock, and broad market commentary:
Our timing model generated a sell signal on close of April 3. However, since the sell signal leading stocks have held up quite well (as have the major averages after the bullish reversal on 4/5) and new buy setups continue to emerge. Because of this, we are placing the timing model in neutral mode. A close above range highs in the S&P 500 would put the model back in buy mode, while a clear break of the 50-day MA on the S&P 500 and Nasdaq Comp. would force the model back on a sell signal.
Stocks sold off late in the session yesterday, with most averages giving back 30-40% of the day’s gains in the final hour of trading. Turnover increased on the session, which could be a sign of some profit taking at the highs. If the S&P fails to move to new highs in the next few days, then we may see choppy price action ahead as the S&P settles in to a trading range. Overall, the market rally is in good shape as it continues to fight off recent distribution.
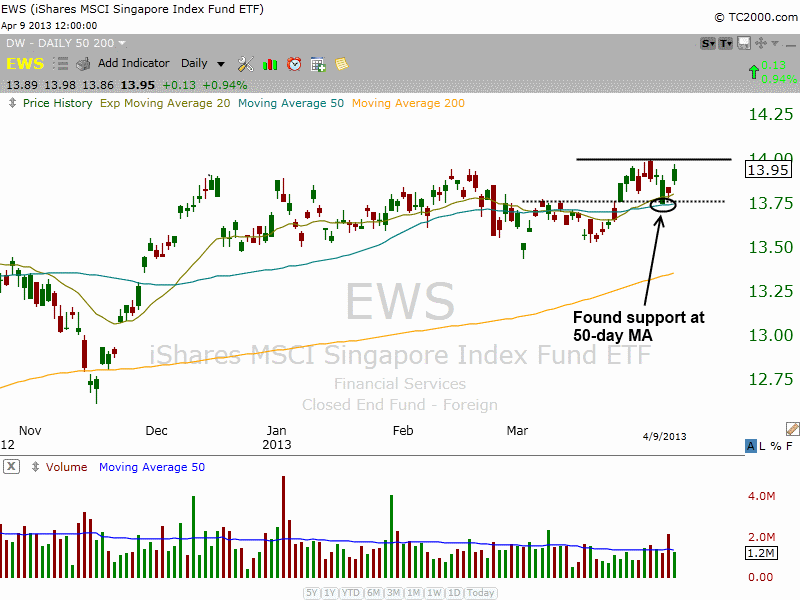
iShares MSCI Singapore Index Fund ($EWS) is back on our watchlist after a failed breakout attempt last February. Since then, the price action has undercut the 50-day MA and popped back above. After another false breakout attempt on April 3, $EWS found support from the rising 50-day MA and prior swing high (dotted black line) around 13.75. We could potentially see a breakout above the 4/3 high take place in $EWS within the next few days, which would be our buy point.

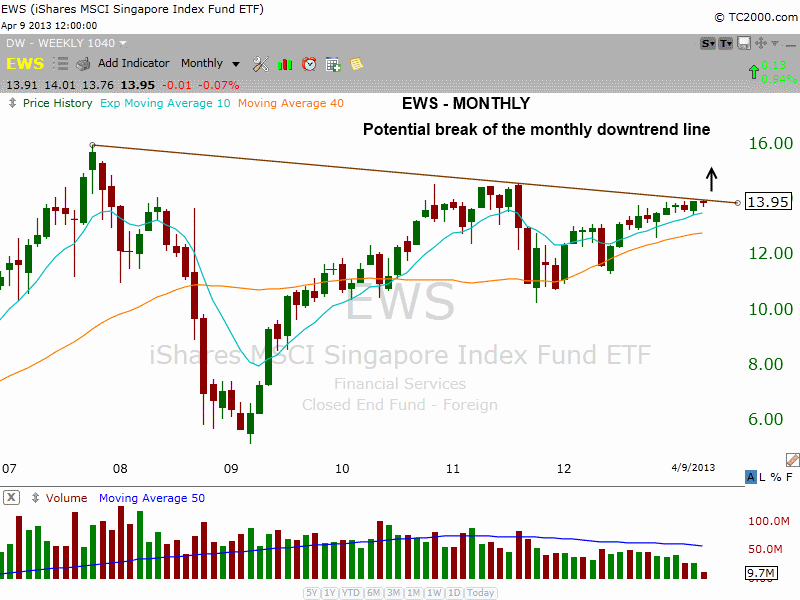
When possible, it is important to have multiple time frames confirming a potential trade (on recent IPOs we can’t). This means that we like to see something interesting happpening on the weekly or monthly chart to support our analysis on the daily chart. That also goes for intraday charts, as the majority of our buy entries are placed above all major moving averages on the 60, 15, and 5 minute time frames. With $EWS, the monthly chart below shows a downtrend line in place with multiple touches. A breakout above the current range high should lead to a break of the monthly downtrend line.

We added two new stock positions to the model portfolio yesterday in $LNKD and $CLDX. $CLDX did not close all that well, but if Tuesday’s low can hold up over the next few days, then the price action should be able to recover and push higher. $LNKD is the top stock in the market (according to our analysis), so we had to get a piece as it moved above the 4-day high.
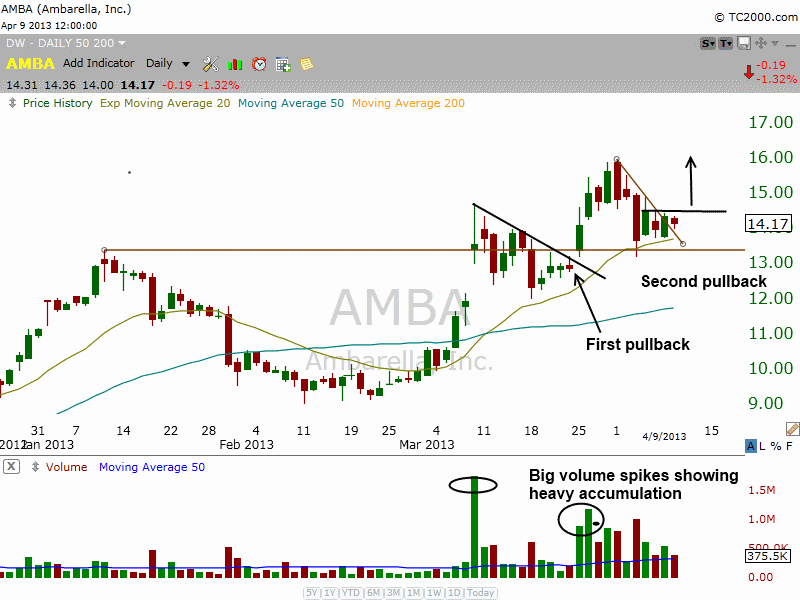
$AMBA remains on the watchlist along with $KKD. However, please note the changes to each setup. $AMBA is a must own IPO with great fundamentals and a top notch relative strength ranking of 98. It is a little light in terms of liquidity, but is fine for our 100k account (those w/ larger accounts of 1 million or more may want to reduce share size).
The recent pullback to the prior breakout pivot and 20-day EMA, along with the tight price action the past few days has produced a low risk buy point over the two-day high.

We sent out an intraday alert Tuesday morning at the open, changing the $CLDX buy limit order to a buy stop order. Although the buy limit order at 11.40 may have triggered for some as the price action did trade at that level twice, our official buy point was above the 5-minute high plus three cents.
relative strength combo watchlist:
Our Relative Strength Combo Watchlist makes it easy for subscribers to import data into their own scanning software, such as Tradestation, Interactive Brokers, and TC2000. This list is comprised of the strongest stocks (technically and fundamentally) in the market over the past six to 12 months. The scan is updated every Sunday, and this week’s RS Combo Watchlist can be downloaded by logging in to the Members Area of our web site.