market timing model:
Confirmed Buy – Signal generated on the close of September 4 (click here for more details) (we are on a buy signal from the close of Aug. 16)
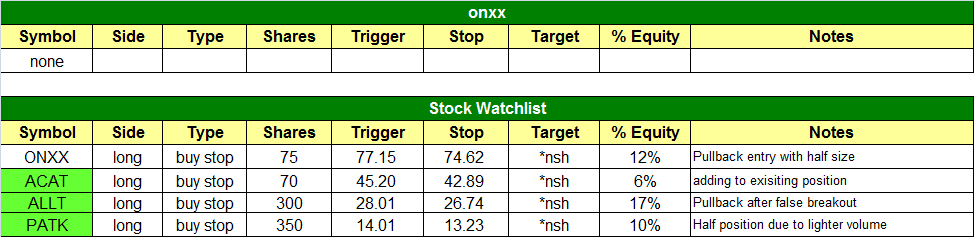
today’s watchlist (potential trade entries):
Having trouble seeing the open positions graphic above? Click here to view it directly on your web browser instead.
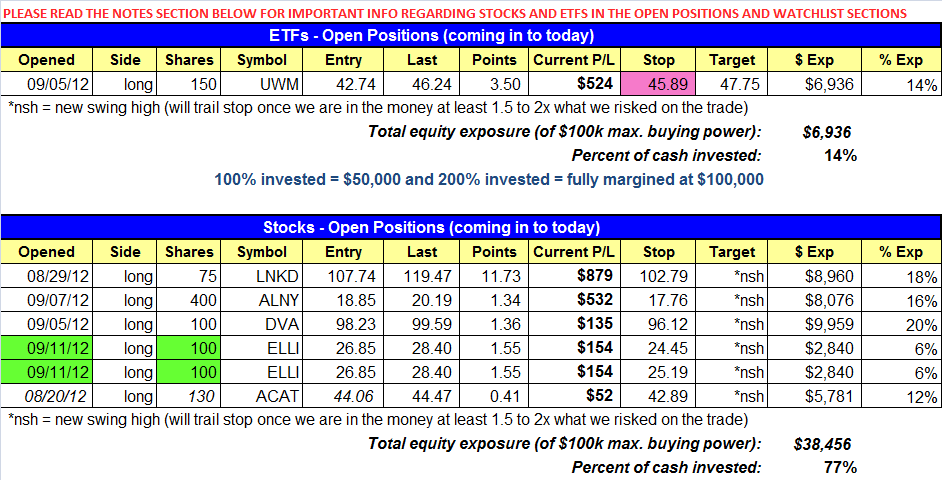
open positions:
Below is an overview of all open positions, as well as a report on all positions that were closed only since the previous day’s newsletter. Net P/L figures are based on two separate $50,000 model portfolios (one for ETFs and one for stocks). Changes to open positions since the previous report are listed in pink shaded cells below. Be sure to read the Wagner Daily subscriber guide for important, automatic rules on trade entries and exits.
Having trouble seeing the open positions graphic above? Click here to view it directly on your web browser instead.
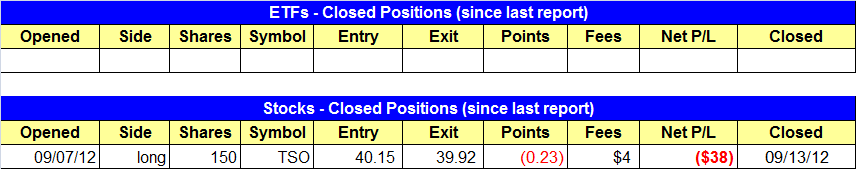
closed positions:
Having trouble seeing the closed positions graphic above? Click here to view it directly on your web browser instead.
ETF position notes:
- We raised the stop in UWM to protect yesterday’s gains.
stock position notes:
- ELLI buy stop triggered. We now have 200 shares total. Note that ELLI is listed twice due to the split stop.
- TSO sell stop triggered and we are out with a scratch loss.
ETF and broad market commentary:
After dull week of trading, the markets exploded higher in the afternoon session in reaction to Thursday’s Fed meeting (see chart below):

The S&P 500 closed up 1.6% with the Dow Jones Industrial Average ($DJIA) and Nasdaq Composite close behind at 1.5% and 1.3% respectively. The small and midcap averages were slight laggards at 1.3% on the Russell 2000 and 1.0% on the Midcap S&P 400.
Thursday’s move was confirmed by heavy volume and solid internals. NYSE volume came in well above its 50-day average and 30% above the prior day’s level. NYSE advancing volume out paced declining volume by a healthy 9 to 1 margin. Nasdaq volume also finished above the 50-day average and 11% above Wednesday. Nasdaq advancing volume beat declining volume by a respectable 3 to 1 margin. The market volume pattern remains bullish, as institutions were actively buying on Thursday.
How much room do the major averages have to run before hitting resistance? Let’s run through the monthly charts to get an idea of what to expect:
The S&P 500 monthly has a bit of room to run before hitting resistance of prior highs. The prior highs are obvious levels of resistance, so the current rally could easily overcut those highs before stalling out.

Unlike the S&P 500, the resistance is not as concrete with the Nasdaq, as it has never fully recovered after selling off from the highs in 2000. There is some resistance at the 3,500 level.

The Midcap S&P 400 is in the best shape of all the major averages. The monthly chart has already cleared the prior highs of 2007 and is poised to breakout to new all-time highs should the current market rally remain healthy. Midcap stocks have lagged the S&P 500 most of 2012 but have outperformed big cap stocks the past few weeks.

The small cap Russell 2000 is also closing in on all-time highs. We prefer to see small and midcap stocks lead the market higher…..institutions are willing to take on risk.

The market rally continues to pick up steam with more groups participating in the advance. The financial sector has picked up some momentum the past few weeks with the Financial Select SPDR ETF ($XLF) breaking out from a six month base on Thursday. Although there are plenty of negatives out there to keep traders from investing in this market, we prefer to focus on the price and volume action and trade what we see, not what we think. Our timing model remains in buy mode and we’ll continue to monitor setups for low risk entry points.
stock commentary:
After a false breakout to new highs, ALLT has pulled back and formed a bullish reversal bar. Our buy entry is over the reversal bar high. ALLT has strong earnings and revenue momentum over the past eight quarters and has a relative strength ranking of 94. We also see the number of funds owning ALLT increase from 78 to 148 over the past 12 months.

Our ELLI add triggered yesterday, which was good timing as ELLI ripped 6% higher on heavier than average volume. PATK was added to the watchlist, but we are taking reduced share size due to the light average trading volume. If you are running a 500k account, you may want to reduce your size further if you want to participate in the trade. ONXX remains on the watchlist. We are taking a half position above 77.00 and will look to add at a higher price.
If you are a new subscriber, please e-mail [email protected] with any questions regarding our trading strategy, money management, or how to make the most out of this report.
relative strength combo watchlist:
Our Relative Strength Combo Watchlist makes it easy for subscribers to import data into their own scanning software, such as Tradestation, Interactive Brokers, and TC2000. This list is comprised of the strongest stocks (technically and fundamentally) in the market over the past six to 12 months. The scan is updated every Sunday, and this week’s RS Combo Watchlist can be downloaded by logging in to the Members Area of our web site.