Signal generated on close of July 7
Building long exposure with a new rally potentially underway. Exposure can be in the 50 – 100% range or more, if one has held on to positions through the market pullback.
Note that the market timing model was not created to catch tops and bottoms in the S&P 500. The model was designed to keep our trades in line with the prevailing market trend. Buy signals (confirmed) are generated when the price and volume action of leading stocks and the major averages are in harmony. This means that we could potentially have a buy signal in a major market average, but if leading stocks are not forming bullish patterns, then we are forced to remain on the sidelines until patterns improve.
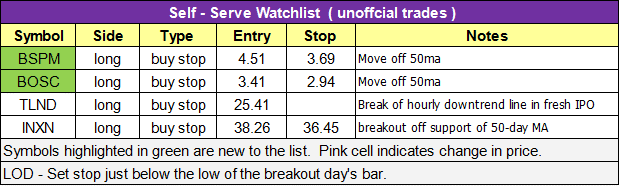
today’s watchlist (potential trade entries):

Having trouble seeing the open positions graphic above? Click here to view it directly on your web browser instead.
Below is an overview of all open positions, as well as a report on all positions that were closed only since the previous day’s newsletter. Changes to open positions since the previous report are listed in pink shaded cells below. Be sure to read the Wagner Daily subscriber guide for important, automatic rules on trade entries and exits.

Having trouble seeing the open positions graphic above? Click here to view it directly on your web browser instead.
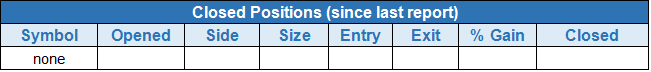
closed positions:
Having trouble seeing the closed positions graphic above? Click here to view it directly on your web browser instead.
position notes:
- No trades were made.
According to our stats, the Nasdaq Composite set a new 52-week closing high last Friday on the lightest volume it has seen in 40 sessions. Also, last week’s price range produced an NR7 bar, which indicates a dry up in price volatility. Generally speaking, whenever price and volume contracts, it eventually has to expand. However, we never really know in what direction the expansion will take place.
All broad market averages are still trading above the 20-day EMA and remain in trend mode.
We continue to monitor $XLV, $IBB, $SMH, and $XLK for clues regarding the health of the Nasdaq. $XLV is still holding on to the 20-day EMA, but a break of $74 would put the chart under pressure in the short-term.
$BABA followed through to the upside on Friday, closing at $98 on big volume. Last week’s explosive action is a very bullish sign in for the intermediate-term (over the next 3 to 6 months). We plan to hold on to the full position through the next consolidation, as there simply is no reason to sell. If possible, we will attempt to add at the first touch of the 50-day MA or on the next breakout from a valid basing pattern.
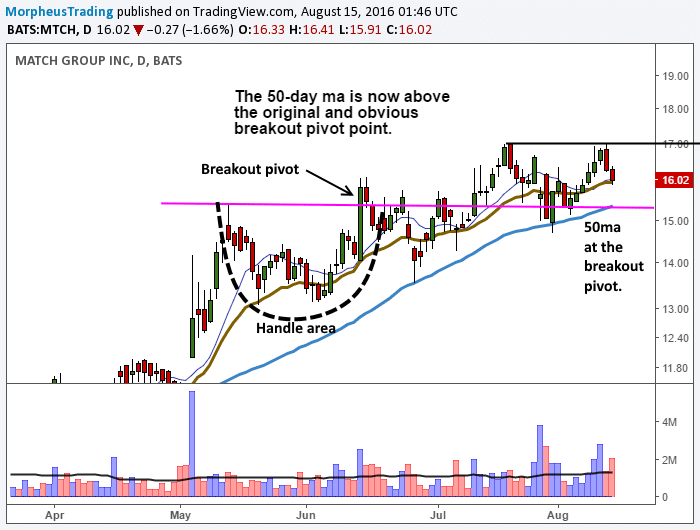
We have one new official buy setup to add to Monday’s watchlist in $MTCH, which is a pullback entry off the 50-day MA.
On the daily chart below, the 50-day MA is now slightly above the high of the handle, which is the original breakout point at $15.40 on 6/14. Although the price has failed to move out, the chart is still in good shape.
Our buy point is off the 50-day MA with a decent amount of wiggle room for the stop. The share size is reduced due to the wide stop.
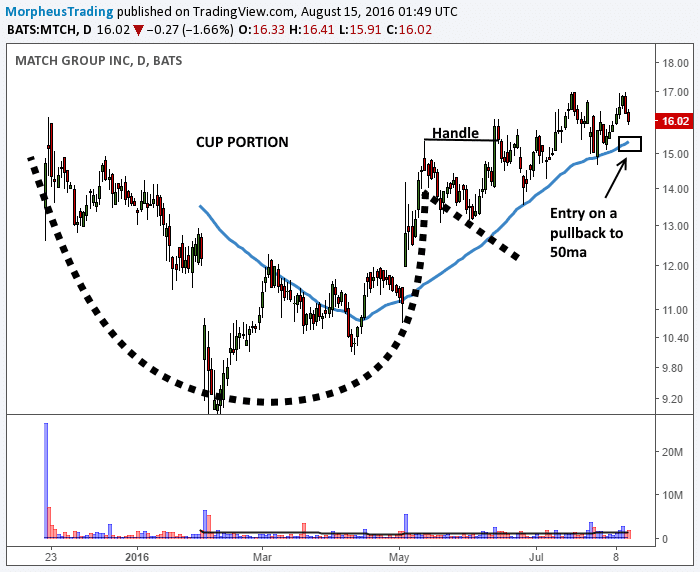
The daily chart shows below shows the full cup with handle pattern that formed.
This is an unofficial watchlist of potential setups for today’s session (trade results will not be monitored). This list is for experienced traders only who are looking for a few ideas. No targets will be listed. Please check for earnings before entering.
All stops are on a closing basis unless listed as a “hard” stop.