BUY Signal generated on close of July 7
Bull market rally. Long exposure can be in the 50 – 100% range or more depending on success of open positions.
Note that the market timing model was not created to catch tops and bottoms in the S&P 500. The model was designed to keep our trades in line with the prevailing market trend. Buy signals (confirmed) are generated when the price and volume action of leading stocks and the major averages are in harmony. This means that we could potentially have a buy signal in a major market average, but if leading stocks are not forming bullish patterns, then we are forced to remain on the sidelines until patterns improve.
today’s watchlist (potential trade entries):

Having trouble seeing the open positions graphic above? Click here to view it directly on your web browser instead.
open positions:
Below is an overview of all open positions, as well as a report on all positions that were closed only since the previous day’s newsletter. Changes to open positions since the previous report are listed in pink shaded cells below. Be sure to read the Wagner Daily subscriber guide for important, automatic rules on trade entries and exits.

Having trouble seeing the open positions graphic above? Click here to view it directly on your web browser instead.
closed positions:

Having trouble seeing the closed positions graphic above? Click here to view it directly on your web browser instead.
position notes:
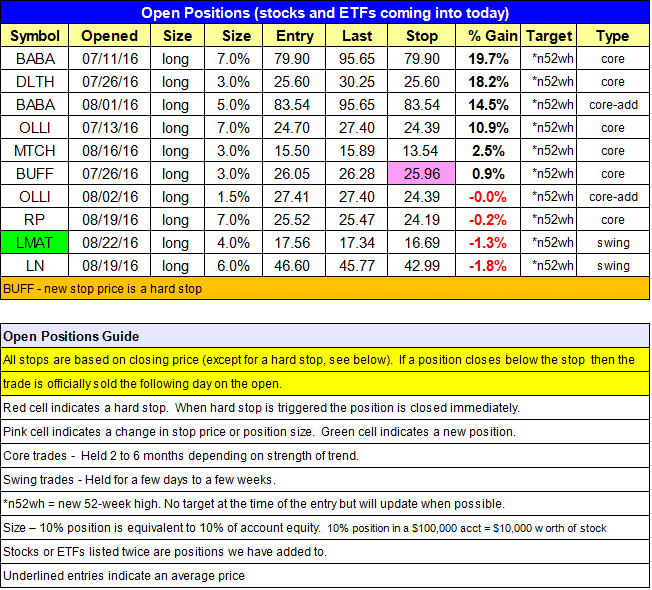
- $LMAT buy entry triggered.
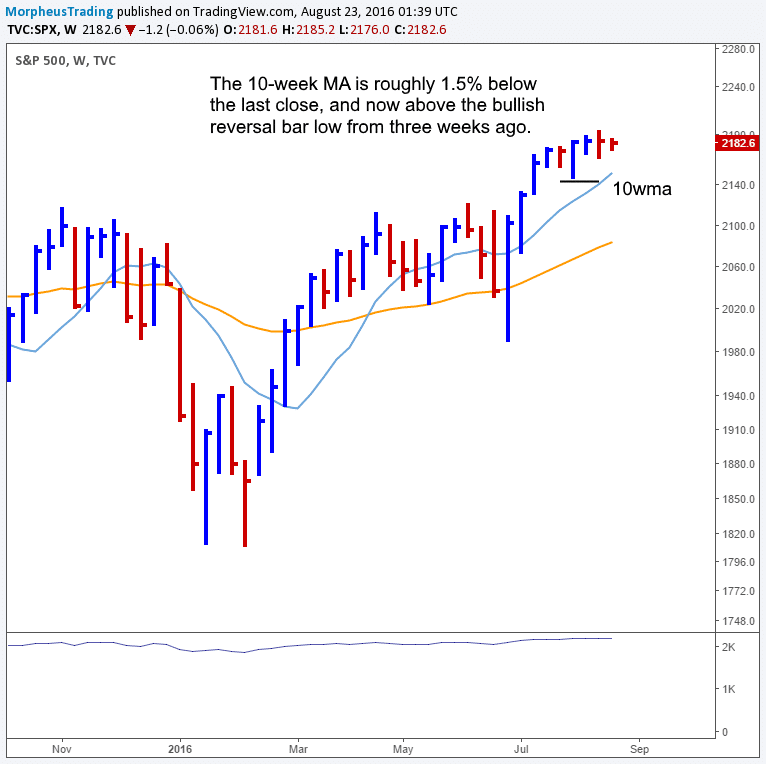
Broad market indices continue to chop around in a fairly tight range, allowing the 10-week MAs on the weekly chart to catch up to the price action.
The weekly chart of the S&P 500 below shows the 10-week MA sitting about 1.5% beneath the last close, which should act as support during any potential pullback. The 10-week MA is now also above the reversal bar low from a few weeks ago at 2147.
The S&P 400 is also roughly 1.5% above the 10-week MA. The Russell 2000 is just over 2%, and the Nasdaq Composite is a little over 3% above.

The $LMAT buy entry triggered but failed to hold on to gains and closed well off the highs of the day. Although the close was not ideal, if Tuesday’s action holds above $17.20 in the morning, then it may have a shot of moving higher later in the day or the following day.
Note that we now have a hard stop in place for $BUFF just below Monday’s low (hard stops are sold right away when hit). We will continue to monitor the action for a pick up in volume.
The buy limit order in $OLLI was reduced to the 20-day MA so that we can take advantage of the short-term weakness and potentially catch a very low risk entry.
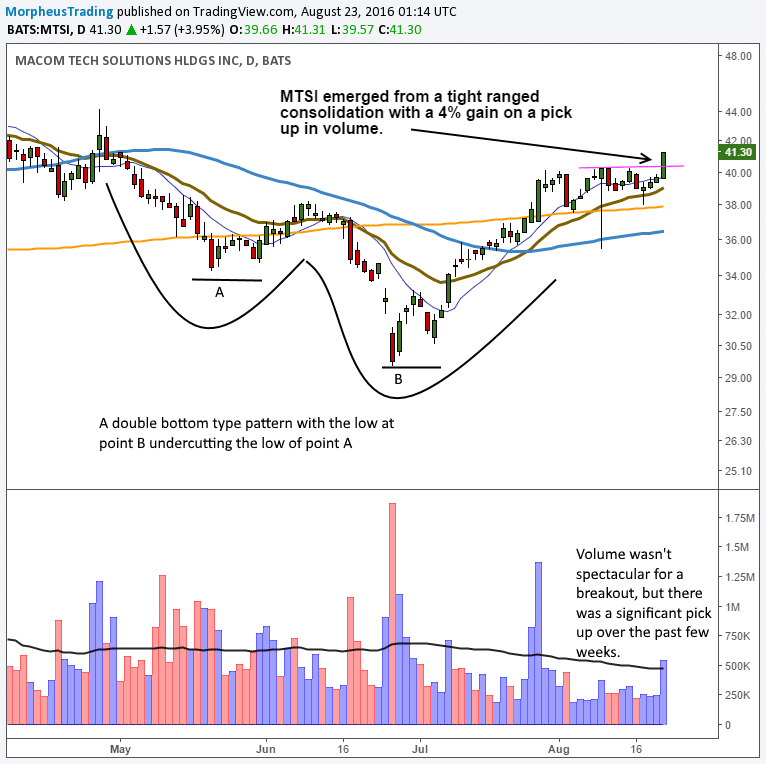
We have one new buy setup on today’s watchlist in $MTSI, which broke out from a tight trading range on a decent pick up in volume. The basing pattern that began in May formed a double bottom through the summer before ripping higher off the lows in July. The strong percentage move off the lows is a very bullish sign.
Although Monday’s volume was a noticeable pick up over the past few weeks, it was a bit low for an obvious breakout. Generally, we prefer to see volume spike at least 100% above the 50-day volume MA for smaller to mid-cap stocks and 40% for larger caps.
Fundamentally, $MTSI has several quarters in a row of strong EPS and revenue growth with an EPS rating of 93 from IBD.
We are placing a buy limit order just above Monday’s high to guard against a bad fill from a gap up. We’d love to get filled at or around Monday’s close. Look for the action to move higher right away as confirmation.
Monday’s close is a bit extended from the recent swing low, so we are going with a split stop to reduce risk but still allow for decent share size.

This is an unofficial watchlist of potential setups for today’s session (trade results will not be monitored). This list is for experienced traders only who are looking for a few ideas. No targets will be listed. Please check for earnings before entering.
All stops are on a closing basis unless listed as a “hard” stop.
