Buy Mode
– Timing model generated buy signal on close of March 5 (click here for more details)
today’s watchlist (potential trade entries):

Having trouble seeing the open positions graphic above? Click here to view it directly on your web browser instead.
open positions:
Below is an overview of all open positions, as well as a report on all positions that were closed only since the previous day’s newsletter. Net P/L figures are based on two separate $50,000 model portfolios (one for ETFs and one for stocks). Changes to open positions since the previous report are listed in pink shaded cells below. Be sure to read the Wagner Daily subscriber guide for important, automatic rules on trade entries and exits.

Having trouble seeing the open positions graphic above? Click here to view it directly on your web browser instead.
closed positions:
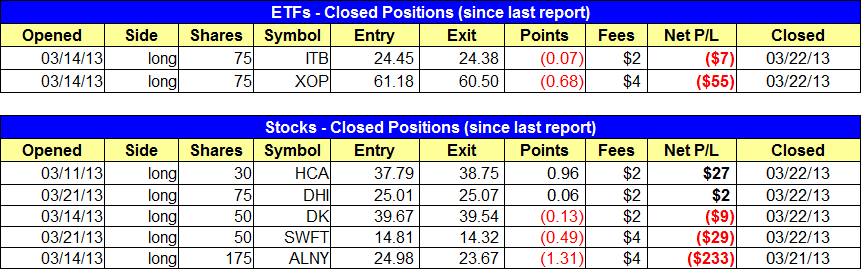
Having trouble seeing the closed positions graphic above? Click here to view it directly on your web browser instead.
ETF position notes:
- Reduced long exposure on Friday by 1/3. However, we will continue to buy ETFs with reduced share size.
stock position notes:
- Reduced long exposure on Friday by 1/3. However, we will continue to buy stocks with reduced share size.
ETF, stock, and broad market commentary:
Please see updates to positions at bottom of commentary
Stocks finished up a choppy week of trading on a positive note last Friday, as the main stock market indexes gained an average of 0.7%. Total volume in the NYSE was lighter than the previous day’s level, but turnover in the Nasdaq ticked slightly higher. Given that the most recent leg of the broad market rally has lacked volume on most of the “up” days, Friday’s accumulation day in the Nasdaq was positive. All the major indices closed at their intraday highs, and near their best levels of the week. Still, all the broad-based indices registered modest losses for the week.
Overall, last week’s price action in the broad market was a tug of war between the bulls and bears. The main stock market indexes held on to key technical levels of near-term price support, such as their 20-day moving averages, but are now trading below their 52-week highs. Overhead supply was created by last week’s indecision, which stocks will quickly need to overcome if the trend is to continue higher in the short-term.
The daily chart of the S&P 500 SPDR ($SPY), a popular ETF proxy for the benchmark S&P 500 Index, shows last week’s “chopfest” in the market, as well as the new support level that was formed by last week’s low:

Based on the mixed signals the market has been giving lately, traders should be prepared for more volatility in the coming week. However, the good news is a clear “line in the sand” has now been drawn.
Since last week’s lows in both the S&P 500 and Nasdaq Composite roughly converges with near-term support of their respective 20-day exponential moving averages, a definitive close below that level (in either index) would likely lead to a correction down to the 50-day moving averages. A more significant correction down to the prior “swing lows” from late February would be quite possible as well.
One ETF we have been watching closely is PowerShares QQQ Trust ($QQQ), which tracks the tech-heavy Nasdaq 100 Index. Specifically, we have been monitoring the bearish head and shoulders pattern that has been developing on the weekly chart interval, which is annotated below:

When determining the validity of a head and shoulders pattern, there are a few factors we look for to determine whether or not this bearish pattern is likely to follow through to the downside.
One of the biggest technical considerations is the trend of the volume that accompanied the price. The best head and shoulders patterns will be marked by higher volume on the left shoulder and lighter volume on the right shoulder. Such a pattern indicates decreasing buying interest as the pattern progresses. As you can see by the 10-week moving average of volume (the pink line on the volume bars above), volume has indeed been declining during the formation of the right shoulder.
Another element we look for is whether the neckline is perfectly horizontal, ascending, or descending. The neckline on the $QQQ chart above is ascending, which means a “higher low” was formed. This ascending neckline slightly decreases the odds of the head and shoulders following through by breaking below the neckline. Nevertheless, between the two technical elements of the volume trend and angle of the neckline, volume is considered a more significant factor in determining whether or not the price is likely to move lower after the right shoulder has formed.
Now, let’s zoom into the rather interesting, shorter-term daily chart interval of $QQQ:

Just as the “line in the sand” for price support of $SPY is last week’s low, the same is true of $QQQ, but even more so.
Notice how support of last week’s low in $QQQ neatly converges with both the 50-day moving average (teal line) AND the intermediate-term uptrend line from the November 2012 low (red line). The more technical indicators that converge in one area to form price support, the more substantial and pivotal that support level becomes. As such, be sure to monitor the $67.60 area very closely in the coming days, as a convincing breakdown below that level could be the impetus that sends $QQQ on its way down to testing the neckline of its head and shoulders pattern.
Despite the convincing head and shoulders pattern of $QQQ, it is important to keep two things in mind.
First, due in no small part to weakness in Apple Computer ($AAPL), the Nasdaq has been a laggard throughout the multi-month rally in the broad market. Instead, the blue chip Dow Jones Industrial Average has been leading, and that index still remains very near its multi-year highs. In a fractured market with significant divergence between the major indices, clear follow-through in either direction usually does not come easily.
The second (and more important) point is that the head and shoulders pattern, like all technical chart patterns, obviously does not work 100% of the time. In fact, far from it. This means that blindly selling short $QQQ (or buying an inversely correlated “short ETF”) at the current price is risky and not advisable.
Rather than entering this swing trade setup based purely on anticipation, our trading system mandates that we first wait for price confirmation that indicates momentum has shifted back in favor of the bears. At a minimum, we would not enter a short position in $QQQ unless/until it breaks down below last week’s low, which we know is a key level of price support. Jumping the gun by trying to get an “early” entry point is never advisable in swing trading.
As always, we will give you a heads-up in advance if/when $QQQ gets added to our “official” watchlist for short/inverse ETF entry. In the meantime, our model ETF portfolio remains positioned in two long positions ($XOP, $ITB) and one short position ($XME).
On the stock side, we plan to re-enter the shares we sold of SWFT due to Friday’s bullish reversal candle. Friday’s selling probably ran more than a few tight stops placed just below the 20-day EMA.

$GEOS and $NTE are also official setups on today’s watchlist. We are playing $NTE for a quick move back up to the prior highs (about 2.5 to 1 reward to risk). $GEOS is a potential breakout to new highs and we are looking for 20-30% gain.
Our weekend scans produced some quality buy candidates especially in the energy sector. Along with our $DK, $PSX, $TSO, and $MPC also look good. $AMBA (a semiconductor IPO) is forming the handle portion of a cup and handle pattern (it has a higher handle).
Over the past few weeks, our main concern has been that the S&P 500 rallied to new swing highs on light volume, which is a clear warning signal in our timing model. Despite the weak volume, breakouts have been working and new setups continue to emerge as money rotates in and out of leading sectors. Our plan is to play the long side with reduced share size until the distribution days begin to cluster.
relative strength combo watchlist:
Our Relative Strength Combo Watchlist makes it easy for subscribers to import data into their own scanning software, such as Tradestation, Interactive Brokers, and TC2000. This list is comprised of the strongest stocks (technically and fundamentally) in the market over the past six to 12 months. The scan is updated every Sunday, and this week’s RS Combo Watchlist can be downloaded by logging in to the Members Area of our web site.