Current signal generated on close of September 9.
Portfolio long exposure can be anywhere from 50% to 100% or more if you have positions that help up while the market sold off.
Past signals:
- Neutral signal generated on close of August 15
- Buy signal generated on close of July 11
- Neutral signal generated on close of July 5
- Sell signal generated on close of June 24
today’s watchlist (potential trade entries):

Having trouble seeing the open positions graphic above? Click here to view it directly on your web browser instead.
open positions:
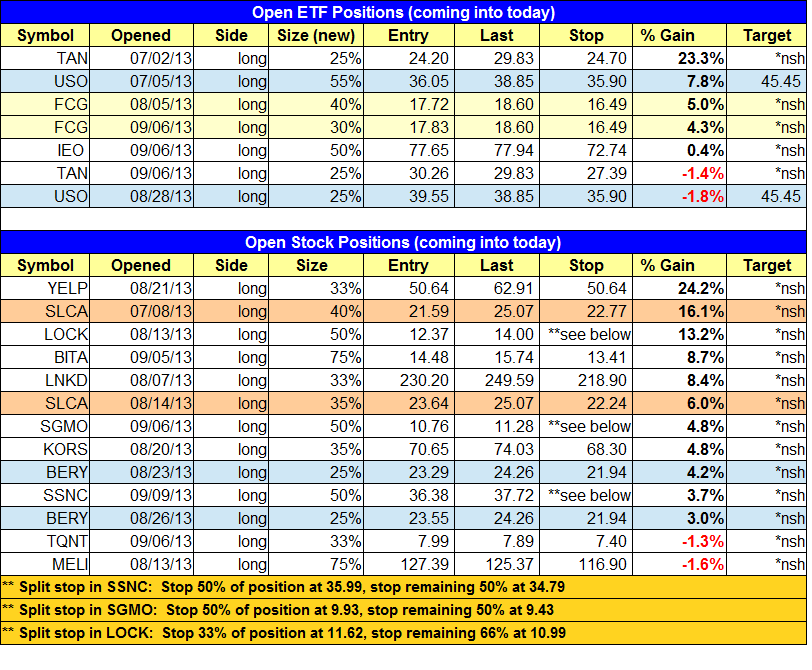
Below is an overview of all open positions, as well as a report on all positions that were closed only since the previous day’s newsletter. Changes to open positions since the previous report are listed in pink shaded cells below. Be sure to read the Wagner Daily subscriber guide for important, automatic rules on trade entries and exits. Click here to learn the best way to calculate your share size.
Having trouble seeing the open positions graphic above? Click here to view it directly on your web browser instead.
closed positions:

Having trouble seeing the closed positions graphic above? Click here to view it directly on your web browser instead.
ETF position notes:
- Note the reduced position size in $EGPT.
stock position notes:
- Note the new entry in $SCTY.
ETF, stock, and broad market commentary:
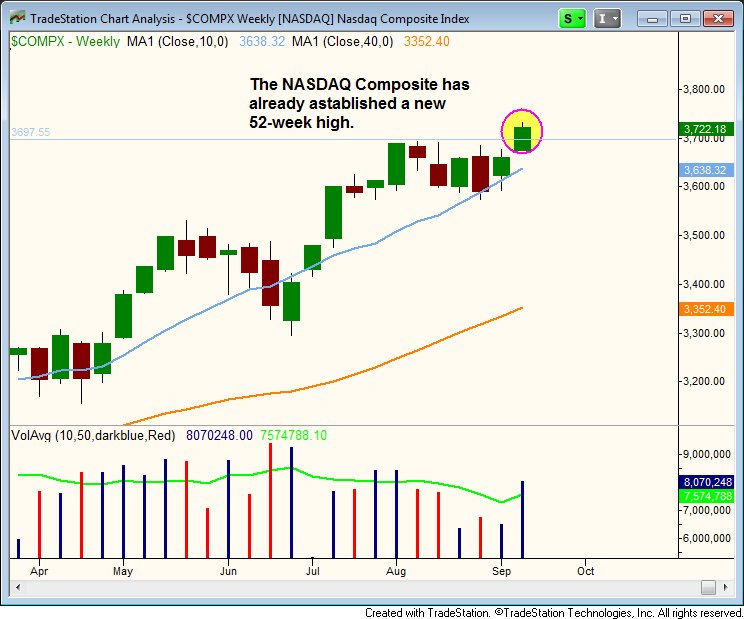
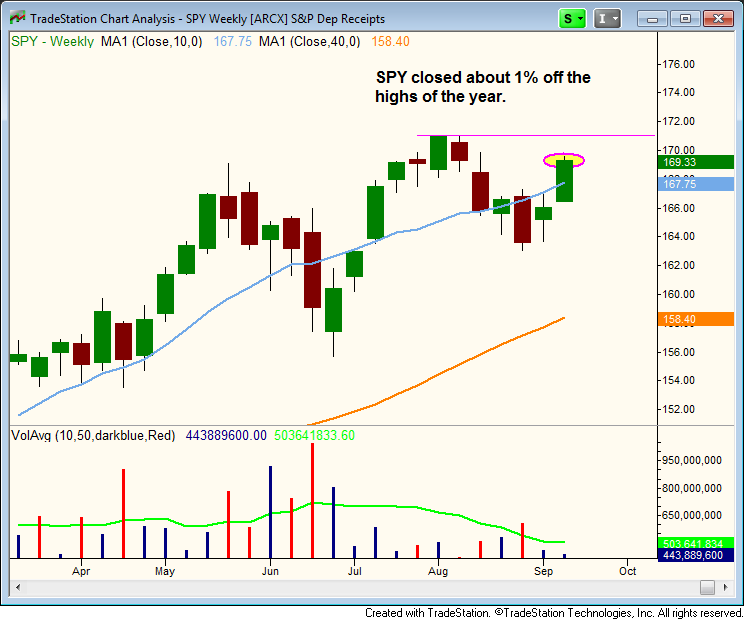
After a strong start to the week, Friday’s chop was the third day in a row of tight ranged price action for most broad based averages. Turnover eased on both exchanges, which is to be expected when the price action is tight. With the NASDAQ Composite breaking out to a new 52-week high last week, our timing model was forced into buy mode, as it is impossible to have a sell signal in place when a major average is setting higher highs and higher lows on the daily chart. The S&P 500 has staged quite a comeback as well, and as of Friday’s close is sitting only 1.2% or so off the 52-week high.
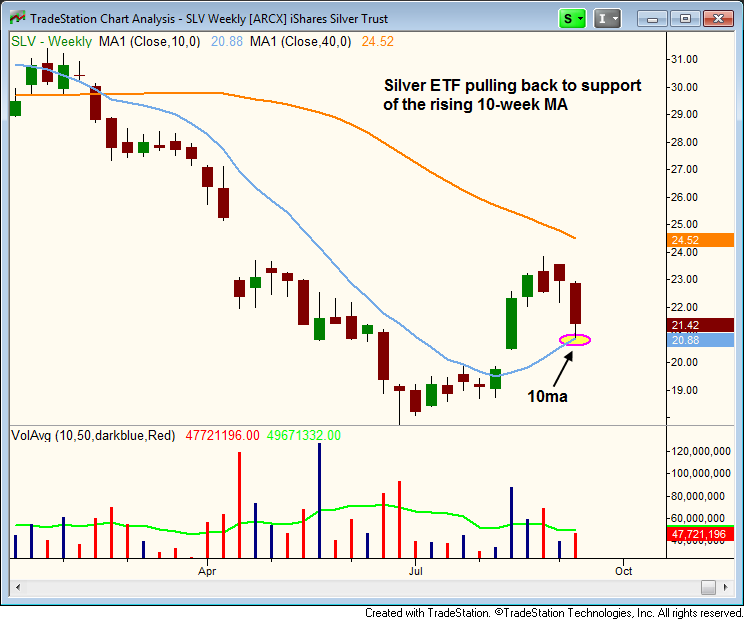
Last week’s sharp pullback in the iShares Silver ($SLV) touched support of the rising 10-week moving average. We are monitoring $SLV for an entry point, especially if it can print some sort of bullish reversal candle near the 10-week MA or 50-day MA this week.
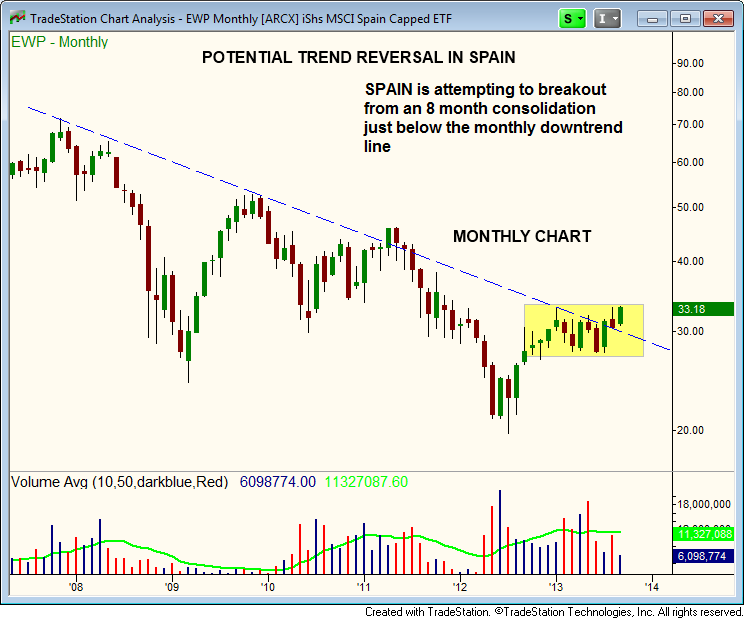
After a strong six month advance off the lows of 2012, iShares Spain ETF ($EWP) has been consolidating in a tight range just below the monthly downtrend line in blue. A potential long-term trend reversal is underway, as $EWP is now trading above the downtrend line and is poised to breakout from a tight, eight month base on the chart below.
On the stock side, our buy limit order in SCTY missed by a penny. Please note the new limit price on the buy watchlist above. $SGMO rallied 7% on heavy volume on Friday to close out the week in impressive fashion.
There are so new setups for today, but we still have two live orders out there in $VNDA and $SCTY.
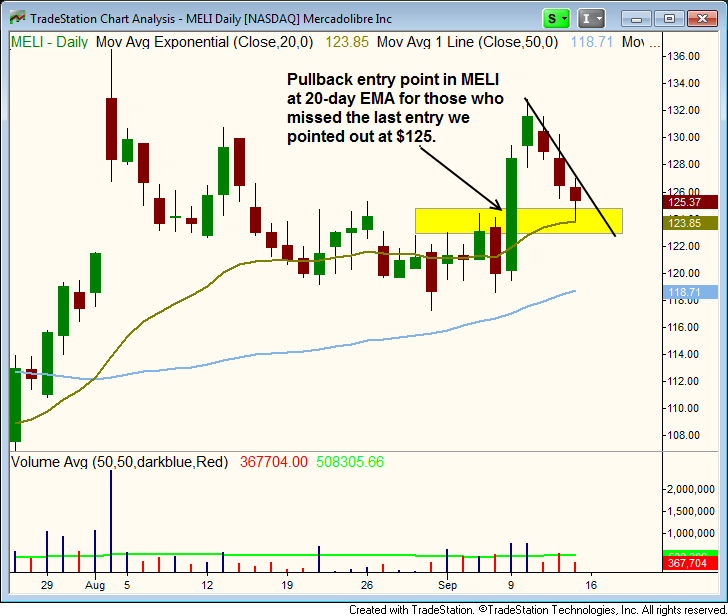
The recent three day pullback to the 20-day EMA on lighter volume in $MELI is a decent spot to add some exposure if you missed our last unofficial buy around the same area on 9/9. One could purchase half the position near the 20-day EMA and add the other half position on a move above last Friday’s high, or simply buy the full position on the open if MELI opens at or above $123.
