Buy
– Signal generated on the close of April 30
Due to the recent distribution in the Nasdaq, we are no longer in confirmed buy mode (now is not the time to step on the gas). We remain in buy mode, but if market conditions continue to deteriorate the timing model will shift to sell mode.
today’s watchlist (potential trade entries):

Having trouble seeing the open positions graphic above? Click here to view it directly on your web browser instead.
open positions:
Below is an overview of all open positions, as well as a report on all positions that were closed only since the previous day’s newsletter. Net P/L figures are based a $100,000 model portfolio. Changes to open positions since the previous report are listed in pink shaded cells below. Be sure to read the Wagner Daily subscriber guide for important, automatic rules on trade entries and exits.

Having trouble seeing the open positions graphic above? Click here to view it directly on your web browser instead.
closed positions:
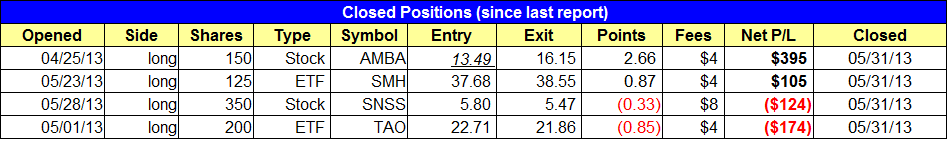
Having trouble seeing the closed positions graphic above? Click here to view it directly on your web browser instead.
ETF position notes:
- Sold partial size of $SMH to lock in a small gain. $TAO hit our stop and we are out with a small loss.
stock position notes:
- Sold partial size in $AMBA, locking in a near $400 gain. $SNSS triggered its stop for half the position.
ETF, stock, and broad market commentary:
The major indices opened lower last Friday, then edged their way higher throughout the first half of the day, but the bears took control in the afternoon and caused stocks to sell off sharply into the close. The main stock market indexes closed 1% to 1.4% lower, as volume ticked higher across the board. As such, both the NASDAQ and S&P to register another bearish “distribution day” that was indicative of selling among banks, mutual funds, hedge funds, and other institutions.
After an impressive, five-month rally that was quite persistent, stocks finally took a rest and registered their largest weekly losses of the year last week. More importantly, we have started to see higher volume declines that indicate the big-money players are selling. As such, you will notice on today’s open position report that we have tightened protective stops on most of our positions in order to lock in gains and/or minimize losses in the event of further selling.
Rather than looking at individual ETF swing trade setups in today’s newsletter, most of which are not looking so hot right now, let’s take an updated look at the technical picture of the NASDAQ Composite. Since the NASDAQ showed the most leadership of the broad-based stock indexes during the most recent leg of the rally, it is the price action of this index we want to pay attention to the most.
Of all the technical indicators at our disposal, volume (and obviously price) is the most important indicator to follow. When stocks are moving higher on increasing volume, it indicates support among institutional players. Conversely, the presence of higher volume selling indicates that the “big boys” are selling. Since institutional trading accounts for more than 50% of the stock market’s average daily volume in any given day, the bias among institutional players always has a direct impact on the subsequent direction of the market.
The biggest concern in the market right now is not that stocks are pulling back from their highs, but that they are doing so on higher volume, along with several instances of “stalling” price action. The daily chart of the NASDAQ below illustrates this:

As you can see, there have been three clear-cut “distribution days” (higher volume declines), along with two days of stalling action, over the past two weeks. This has created clearly-defined resistance at the 3500 level. As such, the stock market will likely need more time to consolidate its recent gains before moving higher. Increasing day to day volatility is also a sign of a market that may be headed for at least a short-term correction.
We view stock market corrections and pullbacks as positive, healthy, and necessary unless two things happen: 1) the major stock market averages start breaking down below the 50 day moving averages 2) leading individual stocks start breaking down en masse, violating obvious levels of support.
So far, all the main stock market indexes are still firmly above their 50-day moving averages. However, the performance of leading stocks has been starting to suffer, which is a warning sign to the bulls.
Many new traders are of the assumption that trendlines need to either be clearly defined levels of support OR levels of resistance. However, this is not always the case. Sometimes, a trendline will act as the upper channel resistance of an uptrend, but then the angle of the uptrend increases, which causes that prior level of trendline resistance to become the new level of support. This is what has happened in the NASDAQ, as you can see on the daily chart below:

Despite recent weakness in the market, both the NASDAQ in small-cap Russell 2000 index are showing relative strength to the broad market by continuing to hold above their 20 day exponential moving averages. Furthermore, if the NASDAQ continues to hold above the trendline shown in the chart above, it will be very positive sign for the broad market. Nevertheless, this is not the time to step on the gas pedal. Instead, it may be best to lock in gains on existing positions of stocks and ETFs you do not intend to hold through a pullback.
On the stock side, we sold 150 shares of $AMBA to lock in some gains ahead of earnings. We are selling another 50 shares Monday morning to bring our size down to 150. With $URI stalling out, we are playing it safe and exiting our small position on Monday’s open to lock in gains. $URI probably needs a few more weeks of consolidation before it is ready, but we will continue to monitor the action for a low risk entry point. We now have a very tight stop in $PFPT, as we are not interested in holding through a potential pullback (if the hourly uptrend line is broken). We stopped out of half of $SNSS on Friday. Last week’s breakout was ugly, so at least we cut down our risk by selling out of half ahead of the original stop. We are not making any changes to $SLCA and plan to hold $AMBA through earnings with 150 shares. Those are the two positions that we do not want to give up.
$DDD and $KORS are two A rated stocks that we are watching for low risk entry points to emerge. $DDD may need a bit more time to consolidate, but $KORS has aleady broken out. However, if market conditions continue to deteriorate, then $KORS may just sit in a trading range above $60 while the market does its thing.
$KORS has broken out of a cup and handle pattern. The handle portion is the short-term consolidation that formed from 5/13 to 5/30. $KORS should hold support around $62, but if conditions weaken, then a deeper pullback to the 20-day EMA can be expected. Since $KORS did not lead the market higher during the recent rally, the new breakout suggests that it potentially could become a market leader during the next run up.

$DDD is still in consolidation mode after a sharp rally off the lows of March. We’d like for $DDD to consolidate for at least two to three more weeks above $44.

With the Nasdaq stalling out at 3500 and logging three clear cut distribution days, we are reducing size and tightening up stops where we can. We plan to lay low this week and see how our open positions and the market plays out. As in sports, sometimes playing the proper defense is the best move in stock trading.