Neutral
– Neutral signal generated on close of June 12
Last buy signal was generated on the close of April 30
today’s watchlist (potential trade entries):

Having trouble seeing the open positions graphic above? Click here to view it directly on your web browser instead.
open positions:
Below is an overview of all open positions, as well as a report on all positions that were closed only since the previous day’s newsletter. Net P/L figures are based a $100,000 model portfolio. Changes to open positions since the previous report are listed in pink shaded cells below. Be sure to read the Wagner Daily subscriber guide for important, automatic rules on trade entries and exits.

Having trouble seeing the open positions graphic above? Click here to view it directly on your web browser instead.
closed positions:

Having trouble seeing the closed positions graphic above? Click here to view it directly on your web browser instead.
ETF position notes:
- No trades were made.
stock position notes:
- No trades were made.
ETF, stock, and broad market commentary:
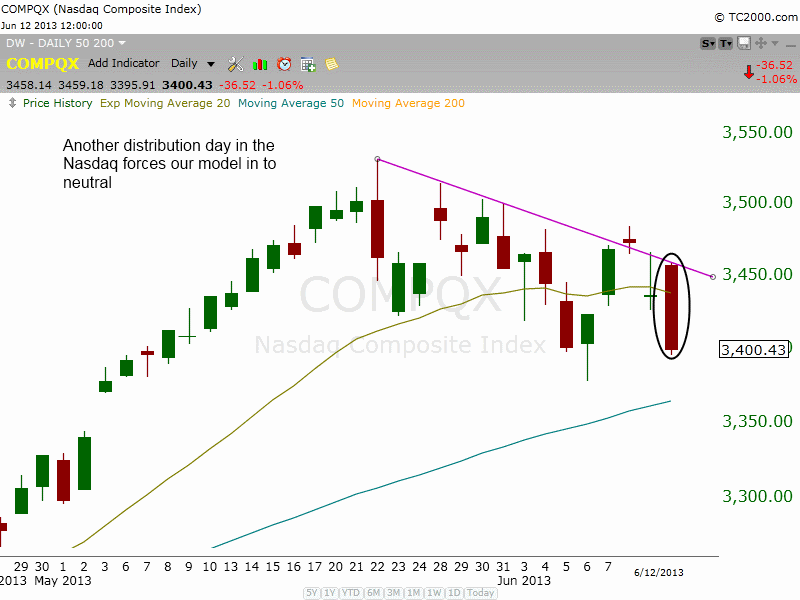
Wednesday was an ugly day for the bulls, as stocks tracked lower all session long with little to no rest. The selling was steady, with all major averages closing near the lows of the day, down -0.8% to -1.1%. A pick up in volume on the NASDAQ produced a second straight day of distribution. Whenever distribution days begin to cluster it is usually not a good sign for the market. Volume was lighter on the NYSE.
The piling up of distribution days the past two weeks forces our model in to neutral. Although there is enough distribution on board in the market to shift to sell mode, leading stocks are still holding up for the most part, preventing an outright sell signal.

We haven’t been active the past two weeks due to the bearish price and volume action in the market. For those who are new to our letter, our main focus is to trade with the trend of the market, so when the trend is in danger of reversing, we prefer to cut back on the number of trades and sit mostly in cash. Patience is key now as we wait for new setups to develop (long or short).
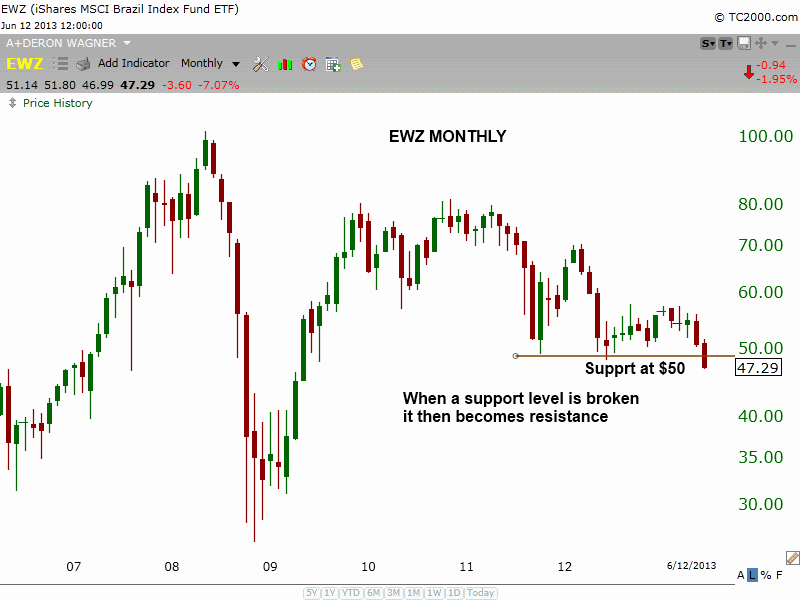
We have a few ETFs we are monitoring on the short side in case market conditions continue to deteriorate. One such ETF is the iShares MSCI Brazil Capped Index ($EWZ). The monthly chart below shows the recent breakdown below support around $50. While we are not looking to establish short positions right now, $EWZ could develop in to a short setup if it breaks down and then bounces back into support at or near $50 (which is now resistance) on light volume. $EWZ hasn’t rallied with the market since the beginning of 2012, and is already breaking down ahead of the market, so it could become a leader to the downside.

On the stock side, we continue to hold $AMBA and $KORS. $KORS sold off on higher volume yesterday, but did manage to bounce off the lows of the session. $AMBA also closed off the lows of the day and is showing great relative strength (still above 10-day MA).
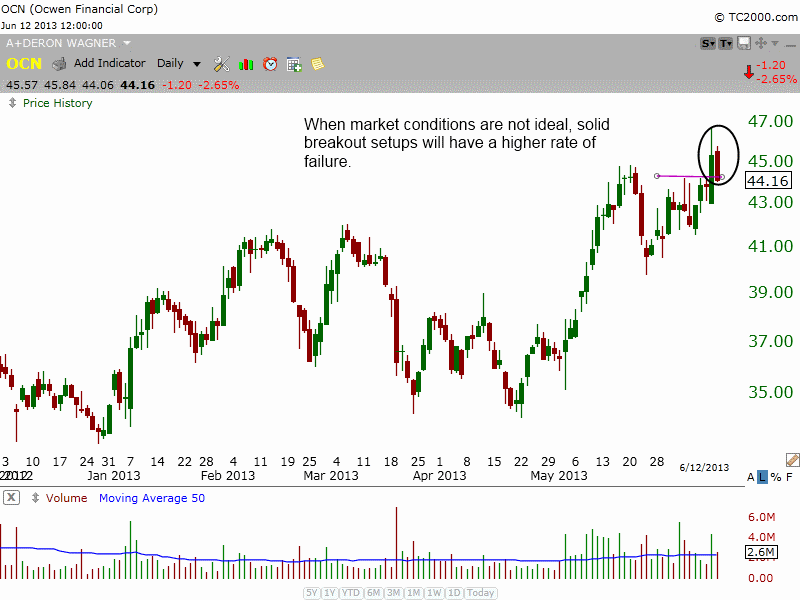
Most breakout attempts have failed the past two weeks, and that is to be expected when the market runs into multiple distribution days and the volume patterns turn bearish. As mentioned yesterday, now is not the time to step on the gas with regard to long exposure. $OSTK has held up really well this week, so it remains on our watchlist.
A solid breakout setup in a strong market can run 15-20% in two to three weeks or less. However, take that same setup when conditions are not ideal, and the outcome will often be quite different. Sometimes the problem isn’t the setup, it’s the market.
