Portfolio exposure can be anywhere from 0% to 60% long (or more), depending on how open positions have held up the past three days.
Past signals:
- Buy signal generated on close of November 13
- Buy signal generated on close of September 9
- Neutral signal generated on close of August 15
- Buy signal generated on close of July 11
- Neutral signal generated on close of July 5
- Sell signal generated on close of June 24
today’s watchlist (potential trade entries):

Having trouble seeing the open positions graphic above? Click here to view it directly on your web browser instead.
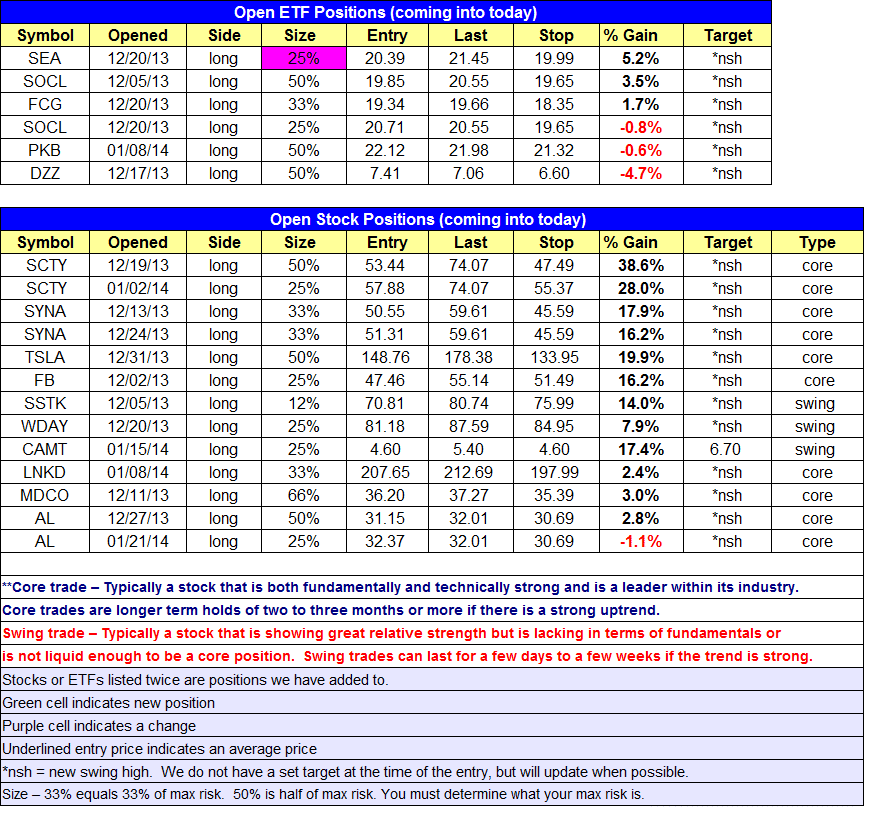
open positions:Below is an overview of all open positions, as well as a report on all positions that were closed only since the previous day’s newsletter. Changes to open positions since the previous report are listed in pink shaded cells below. Be sure to read the Wagner Daily subscriber guide for important, automatic rules on trade entries and exits.

Having trouble seeing the open positions graphic above? Click here to view it directly on your web browser instead.
closed positions:

Having trouble seeing the closed positions graphic above? Click here to view it directly on your web browser instead.
ETF position notes:
- Per yesterday’s report, sold half of $SEA on the open.
stock position notes:
- No trades were made.invest
ETF, stock, and broad market commentary:Stocks finally stabilized on Tuesday, with all broad market averages closing in positive territory, led by a 0.9% gain in the small and mid-cap averages. Although the market moved higher, the action didn’t pack much of a punch, as the S&P 500 and Dow Jones failed to clear the high of Monday’s narrow bar. Volume was as light as well, so not much to get excited about for the bulls.
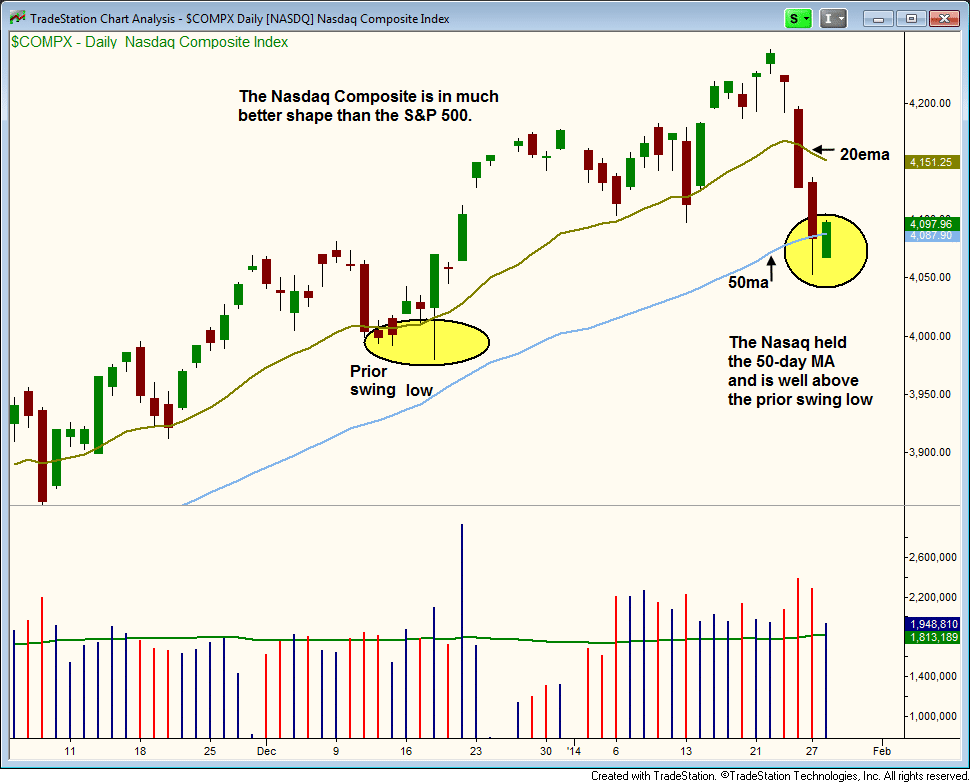
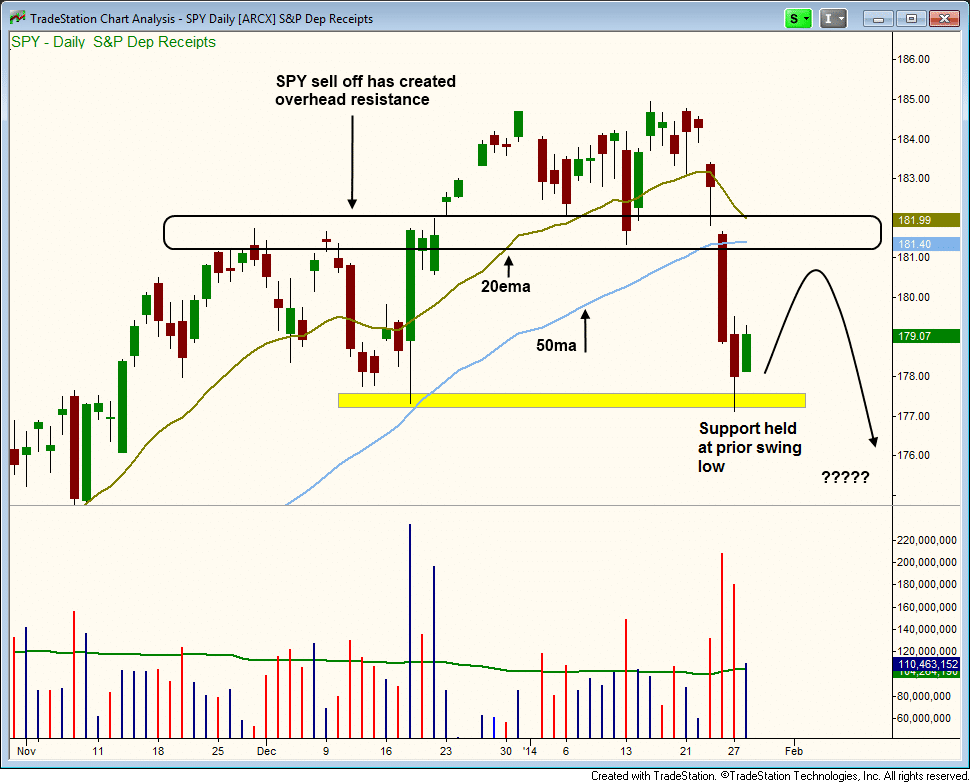
All major averages except for the Nasdaq Composite are still below the 50-day MA. However, all averages are still trading above the last major swing low, so the uptrend (in our opinion) is still intact.
The daily chart clearly shows that the Nasdaq Composite is in much better shape than the S&P 500.
 The Nasdaq is closer to overhead resistance, and because of this will not have to cover as much ground to clear resistance. The uptrend remains in decent shape. The 50-day MA has held up and the action is still well above the last major swing low. The 20-day EMA is beginning to turn down and will offer some resistance, but is not in danger of crossing below the 50-day MA yet.
The S&P 500 has obviously cracked the 50-day MA, and has pulled back to support of the last major swing low. Note that the 20-day EMA has turned down and is close to crossing below the 50-day MA, which would signal that the uptrend needs a few weeks of rest (at the very least). Because the selloff was so sharp, SPY will have to waste quite of bit of energy just to rally up to major resistance at the $181 – $182 level (if it can get there).
 As mentioned yesterday, aside form a potential pullback entry in the Natural Gas ETF ($UNG), we are not looking to initiate new long positions in the ETF portfolio. We are still long $SEA, $SOCL, $FCG, $PKB, and $DZZ, so we do have a few positions on that could still run higher if the market is able to recover.
It is still too early to go short, but if the S&P 500 fails to return back above the 50-day MA and sets a lower high and a lower low, then the short side will be in play.
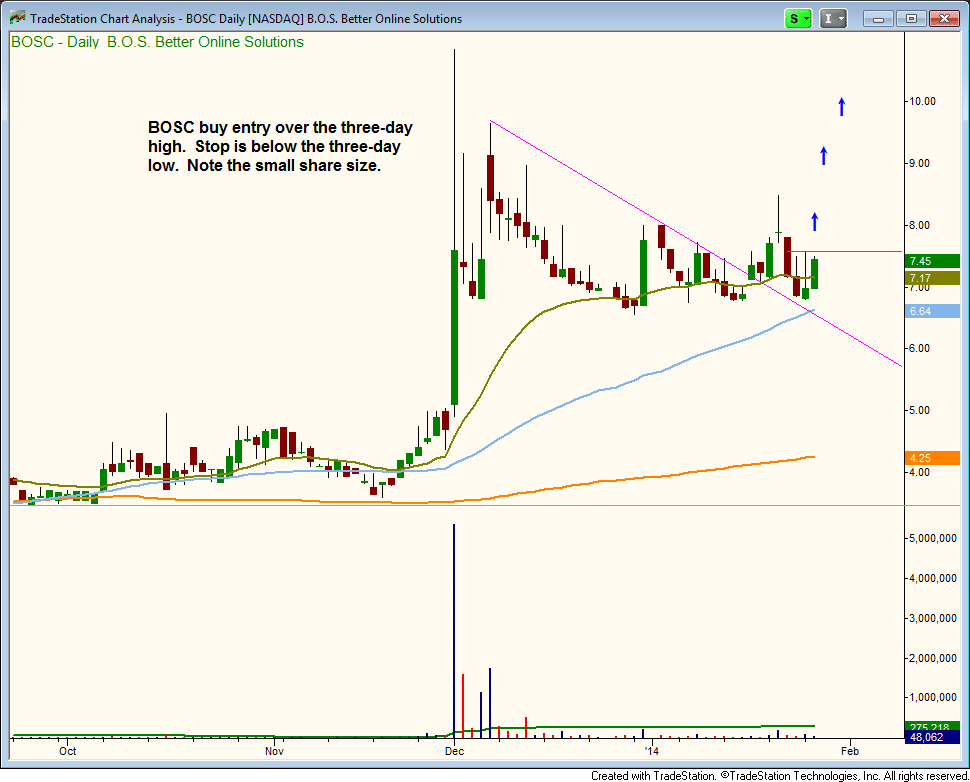
We have one new setup tonight on the stock side in $BOSC, which is not an A rated stock. We are going with small share size, as this is basically our style of day trading, where we buy a cheap stock and look for a quick 3 to 10 day pop. This trade is not going to make you a ton of money, but if it works we could potentially make 3x what we risk.
 We still have on plenty of long exposure in leading stocks. $FB reports earnings after the close on Jan. 29, so if you do not want the risk of holding through earnings you should sell by 4pm. We are holding through earnings with our original entry, so we have a decent buffer.