Current signal generated on close of Feb. 3.
Portfolio exposure can be anywhere from 0% to 60% long (or more), depending on how open positions have held up.
Past signals:
Neutral signal generated on close of January 24.
- Buy signal generated on close of November 13
- Buy signal generated on close of September 9
- Neutral signal generated on close of August 15
- Buy signal generated on close of July 11
- Neutral signal generated on close of July 5
- Sell signal generated on close of June 24
today’s watchlist (potential trade entries):

Having trouble seeing the open positions graphic above? Click here to view it directly on your web browser instead.
Below is an overview of all open positions, as well as a report on all positions that were closed only since the previous day’s newsletter. Changes to open positions since the previous report are listed in pink shaded cells below. Be sure to read the Wagner Daily subscriber guide for important, automatic rules on trade entries and exits.

Having trouble seeing the open positions graphic above? Click here to view it directly on your web browser instead.
closed positions:
Having trouble seeing the closed positions graphic above? Click here to view it directly on your web browser instead.
ETF position notes:
- No trades were made. $UNG buy stop was canceled due to the gap up being more than 1.3% above our entry.
stock position notes:
- No trades were made.
ETF, stock, and broad market commentary:
Although stocks closed higher with decent percent gains across the board, Monday’s selling action was so ugly that a 1.2% gain in the S&P 400 on Tuesday only recovered about 1/3 of the prior day’s loss.
Stocks struggled to push higher, which is evident on the 15-minute charts of all major averages, as they lacked any impulsive action. The true test for the averages will come when the they eventually meet up with the declining 20-period EMA on the hourly chart, which has acted as a brick wall since the sellof began.
Our timing model is currently in sell mode. However, we have noticed the Nasdaq Composite has held up relatively well against the S&P 500 and Dow Jones. Looking at a daily chart of the Nasdaq vs SPY below, the Nasdaq is still trading above the prior swing high and is well above the 200-day MA. The Nasdaq is only one big accumulation day away from reclaiming the 50-day MA.
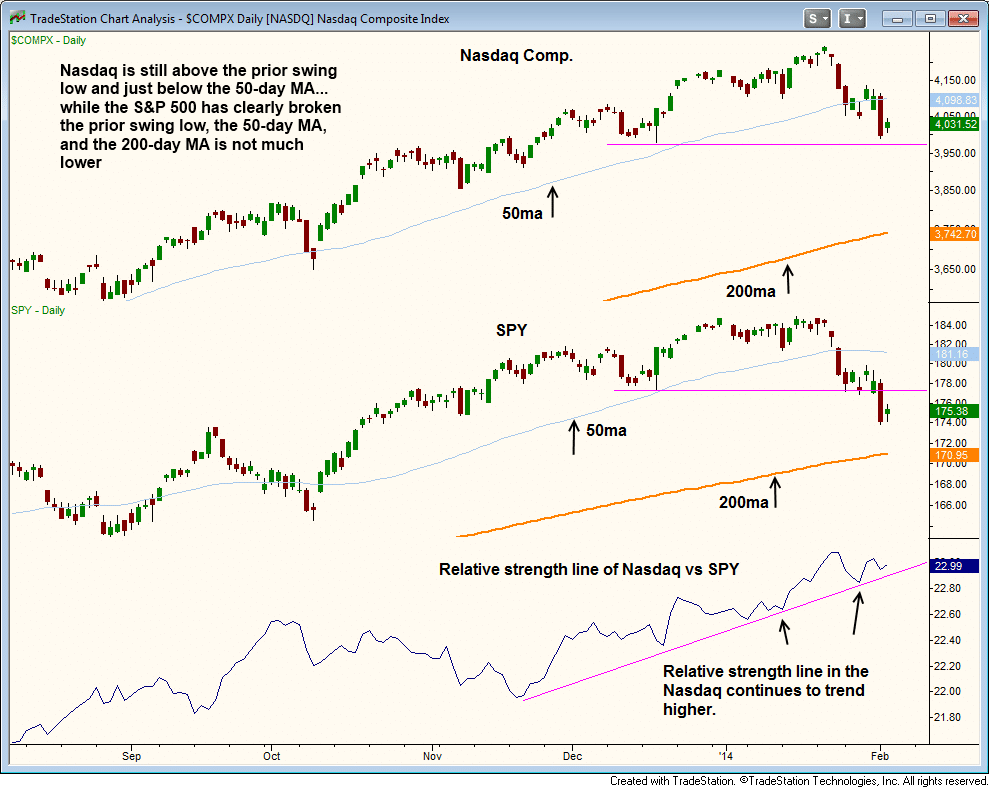
Note the relative strength line at the bottom of the chart above, which is simply the close of the Nasdaq divided by the close of SPY. Although the Nasdaq has made lower lows the past few weeks, the relative strength line continues to set higher lows.
Because of this, we are hesitant to say that the rally in the Nasdaq is dead, as it may simply need several weeks of basing action (at the very least) before it can move higher.
In scanning through the top 20 dollar volume trading stocks in the Nasdaq, we see a majority of these charts holding up above the 50-day MA or a prior swing low.
- Stocks in good to decent shape: $FB $GOOG $NFLX $MSFT $TSLA $EBAY $GILD $QCOM $CSCO (has actually formed a higher low) $PCLN $CMCSA $BIDU $INTC $MU $WYNN
- Stocks breaking down: $AAPL $AMZN $YHOO $INTC & CELG (though both back at prior support) $SBUX (by far the ugliest)
About 65-70% of the daily charts in top Nasdaq names remain in good shape. Until this changes, we have to assume that the Nasdaq may still have more upside once the current consolidation is over.
That being said, the relative weakness in the S&P 500 and Dow Jones will prevent the Nasdaq from gaining much ground even if it it does reclaim the 50-day MA by the end of the week.
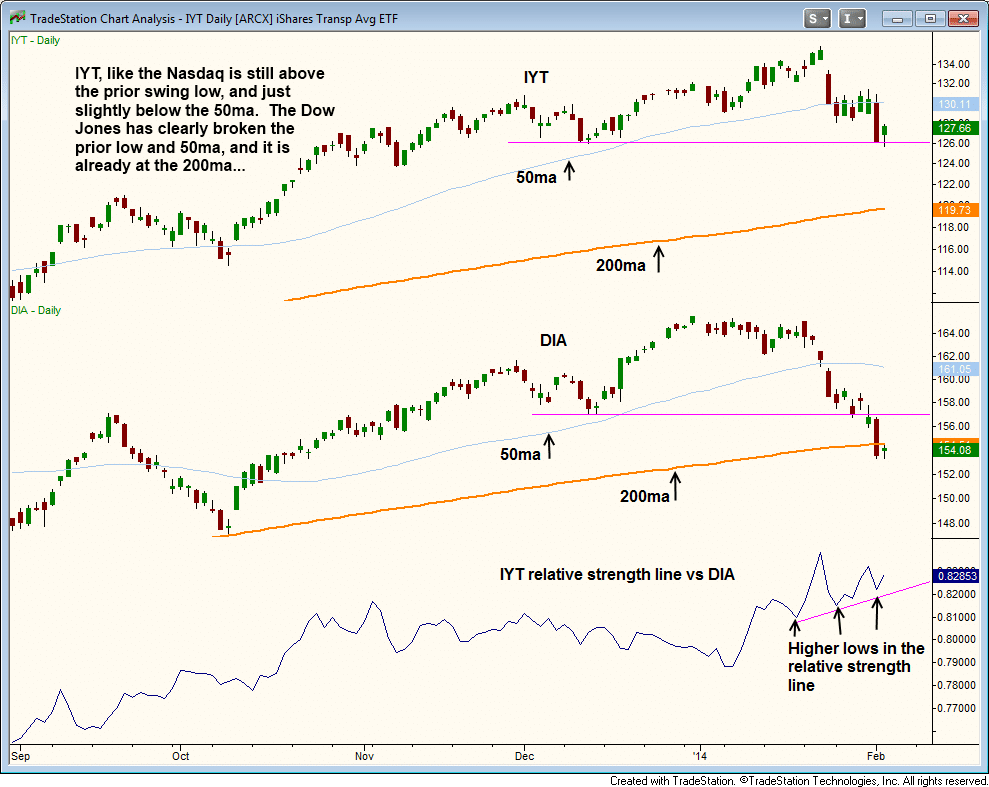
Along with the Nasdaq, we also noticed relative strength in the Transportation ETF ($IYT), which has held above a prior swing low and is just below the 50-day MA.
Its relative strength vs. the Dow Jones is interesting, as we would have expected $IYT’s performance over the past few weeks to mirror the Dow. Because the transports are often used as a leading indicator for market direction, its relative strength may be a sign that the market should not be heavily shorted until further confirmation.
The relative strength line in $IYT is still making higher lows due to the Dow Jones selling off to the 200-day MA.
Per yesterday’s report, we planned to add to our existing long position in $UNG above the two-day high, but the morning gap was well above our limit on a buy stop, so the trade was canceled. $UNG is currently up about 10% from our entry point. If the price action fails to set a new swing high this week, then we could see a short-term pullback to the rising 20-day EMA within the next week or two.
The recent strength in $UNG is a good example of how ETFs can be used to locate trends outside of equities, especially when broad market conditions begin to deteriorate.
Regarding the short side of the market, it is still too soon to short with a low risk entry price. If the market bounces on light volume for a week or two, then we could possibly see some decent setups develop.
On the stock side, we continue to lay low while holding on to several core positions with 50% size.
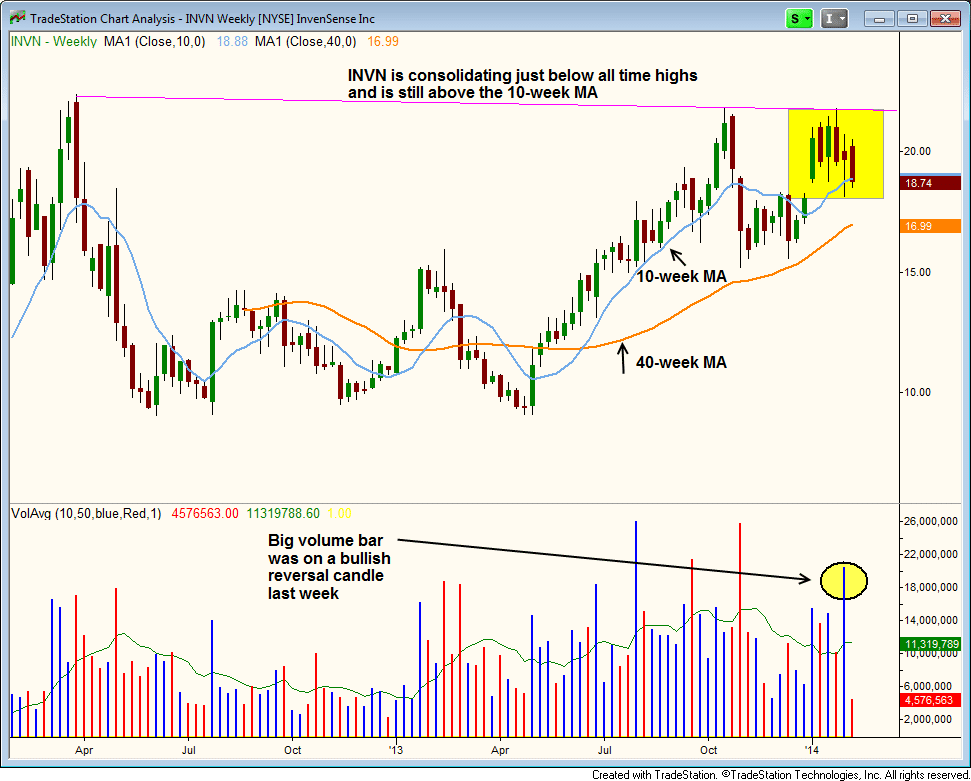
$INVN is a setup we are monitoring for a potential long entry off the 10-week MA. This a potential breakout to new all-time highs, if it does eventually go, making it quite a powerful setup (when conditions are healthy).
Last week’s spike in volume was on a bullish reversal canlde, closing well off the lows of the week. That is great price action vs the market! One could make the case to establish a small 15-25% position at current levels looking for the 10-week MA to hold. However, we are simply monitoring the action for now.
A quick note on the timing model. Just because we are on a sell signal does not mean that we can’t buy stocks or ETFs. Our timing model is a guide, not a set of concrete rules. That being said, we know that when in sell mode, establishing 3-5 new positions in a week without any improvement in the model is a bit too risky. However, adding 1 or 2 new positions with light size is fine.