Buy Mode
– Timing model generated buy signal on close of March 5 (click here for more details)
Please read commentary below regarding the new model portfolio. Stock and ETF positions are now combined in to one simple portfolio.
today’s watchlist (potential trade entries):

Having trouble seeing the open positions graphic above? Click here to view it directly on your web browser instead.
open positions:
Below is an overview of all open positions, as well as a report on all positions that were closed only since the previous day’s newsletter. Net P/L figures are based on two separate $50,000 model portfolios (one for ETFs and one for stocks). Changes to open positions since the previous report are listed in pink shaded cells below. Be sure to read the Wagner Daily subscriber guide for important, automatic rules on trade entries and exits.

Having trouble seeing the open positions graphic above? Click here to view it directly on your web browser instead.
closed positions:

Having trouble seeing the closed positions graphic above? Click here to view it directly on your web browser instead.
ETF position notes:
- Cancelled $FDN and $XOP buy setups. $FDN buy setup did not officially trigger due to the 5-mintue rule.
stock position notes:
- Cancelled $SWFT and $GEOS buy setups. $SODA buy setup triggered. $MX buy setup did not officially trigger due to the 5-mintue rule.
ETF, stock, and broad market commentary:
PLEASE READ THE FOLLOWING NOTE: In order to improve the format of The Wagner Daily for our members, we have begun listing both the ETF and stock trades in one simple model portfolio (rather than two separate model portfolios).
To accommodate both stocks and ETFs, the new cash account value of the single model portfolio is $100,000. The account will remain marginable, with total maximum buying power at $200,000.
The new portfolio sizing also makes account sizing much easier than before, as a 10% position is now simply $10,000, while a 15% position is $15,000.
The goal of the model portfolio remains the same as before, but now with just one easy to follow account. We will still trade whatever the market is offering at any given time, and the quantity of stock and ETF trades will remain exactly the same as before.
If there is a strong uptrend in the broad market, the portfolio will be overweight in US stocks. Conversely, when conditions are less than ideal in domestic markets, the portfolio may be underweight US stocks, while locating international, commodity, fixed income, or currency ETFs in a strong trend.
Overall, this format change is pretty small, but we just wanted to make sure you were clear on the change. If you have any questions on this, just reply to this email and we’ll help you out.
Stocks sold off sharply in the first 90-minutes of trading before finding support around 11 am. While stocks slid lower once again in the afternoon, most of the damage was done earlier in the day. By the close, the S&P 500 was down only 0.5%, but the leading small cap Russell 2000 gave back 1.3%. Some stocks were clearly being sold, but that is bound to happen when the market rotates out of extended names. The good news is that volume did not expand on the session, which prevented the S&P and Nasdaq from logging a fifth distribution day.
We are cancelling the $FDN and $XOP buy setups. With $XOP, we still plan to add within the next few days if the price action holds the 50-day MA. $FDN has wedged higher for two weeks and once again failed to hold above the 20-day EMA. Although $FDN triggered our buy entry on the open we did not officially enter due to the 5-minute rule. This rule is very simple and has worked extremely well over the years by keeping us out of most false triggers. The rule is to ignore any entry that triggers within the first five minutes of trading. After 5-minutes have passed, we mark the 5-minute high and add 10 cents as the new buy entry. It is a very simple rule but incredibly effective.
$XME (short position) moved in our favor yesterday, so we are now running a break-even stop above the two-day high. We updated the target to cover as well at 37.20, which is a test of the lows of last July.
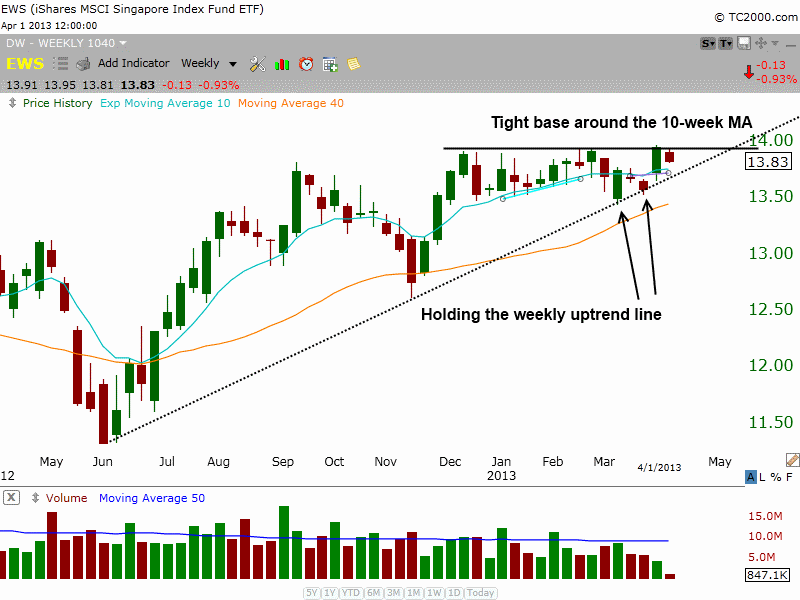
The iShares MSCI Singapore Index Fund ($EWS) continues to trade in a tight range on the weekly chart after a shakeout beneath the range lows in late February / early March. The weekly chart still looks good:

The last selloff found support at the weekly uptrend line on March 4 and March 19. With the uptrend line holding, it looks as if the current consolidation is running out of time and will either have to breakout or breakdown below the uptrend line within the next few weeks.
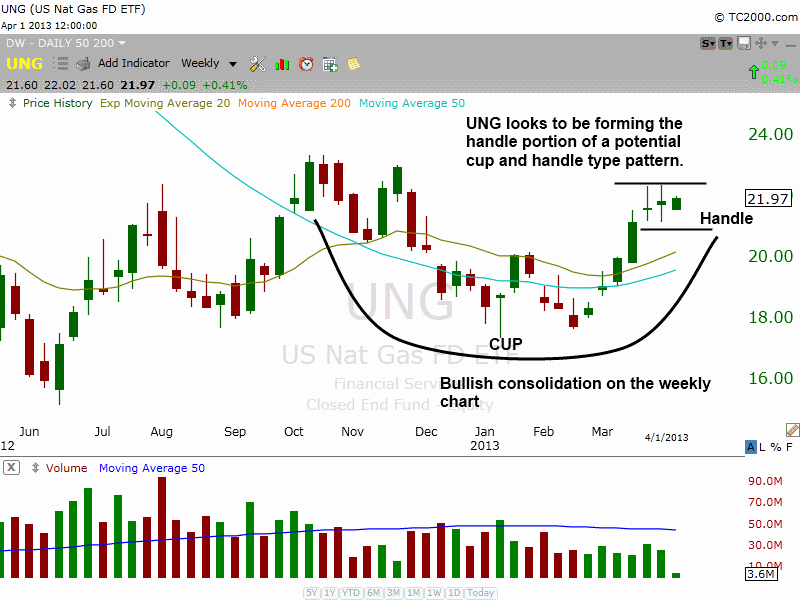
We continue to monitor United States Natural Gas Fund ($UNG) for a low risk entry point. It looks to be forming a cup and handle type pattern on the weekly chart. The left side of the pattern begins in November (2012), after a 60% run up off the lows. Proper cup and handle patterns do not form at or near 52-week lows, so there should be an uptrend in place for a few months for a correct cup and handle to form. The selloff in December, as well as the bottoming action in January and February combine to form the left side and bottom of the cup. The right side of the pattern was formed when $UNG broke above the 200-day MA and rallied to $22.

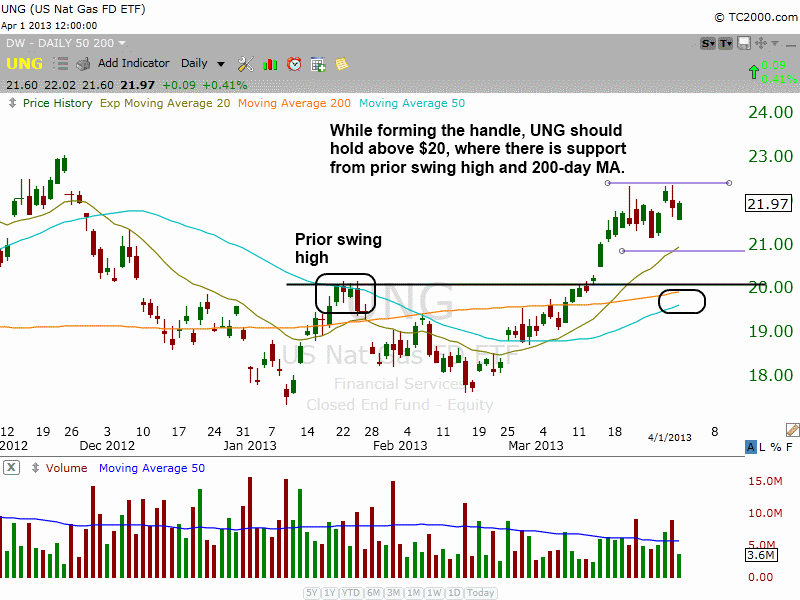
The daily chart shows the handle portion of the pattern forming. The handle should take a few weeks to properly develop, with the price action sloping lower and potentially undercutting the low of March 25. The price action should hold above $20 during any pullback. A break of this important support level could signal that the pattern needs a few more months to work itself out.

On the stock side $MX did not officially trigger due to the 5-minute rule. We are cancelling the $GEOS, and $SWFT setups for now. $MX and $PRLB setups remain live, but if they continue to pullback we might be able to cancel the current buy setups and look for a lower entry point.
$SODA triggered and closed up 2.5% on heavy volume. The pick up in volume was a great sign after several weeks of light volume. Our 50.29 entry is an average price.
$DK recovered nicely in the afternoon, forming a bullish reversal candle after a quick shakeout below the 20-day EMA. Our stop is now below Monday’s reversal candle, as it should hold this level if it is to continue to set higher lows in the base.

relative strength combo watchlist:
Our Relative Strength Combo Watchlist makes it easy for subscribers to import data into their own scanning software, such as Tradestation, Interactive Brokers, and TC2000. This list is comprised of the strongest stocks (technically and fundamentally) in the market over the past six to 12 months. The scan is updated every Sunday, and this week’s RS Combo Watchlist can be downloaded by logging in to the Members Area of our web site.