market timing model:
Neutral – Signal generated on the close of October 5 (click here for more details)
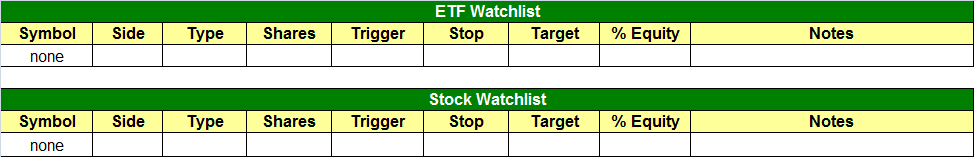
today’s watchlist (potential trade entries):
Having trouble seeing the open positions graphic above? Click here to view it directly on your web browser instead.
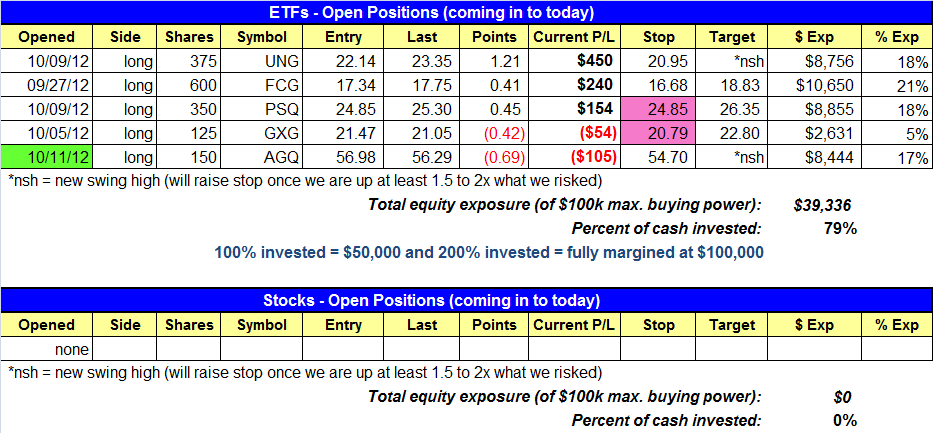
open positions:
Below is an overview of all open positions, as well as a report on all positions that were closed only since the previous day’s newsletter. Net P/L figures are based on two separate $50,000 model portfolios (one for ETFs and one for stocks). Changes to open positions since the previous report are listed in pink shaded cells below. Be sure to read the Wagner Daily subscriber guide for important, automatic rules on trade entries and exits.
Having trouble seeing the open positions graphic above? Click here to view it directly on your web browser instead.
closed positions:

Having trouble seeing the closed positions graphic above? Click here to view it directly on your web browser instead.
ETF position notes:
- AGQ long position triggered.
stock position notes:
- No trades were made.
ETF and broad market commentary:
Attempting to snap a four-day losing streak, stocks initially opened higher in yesterday’s session. However, the bears immediately stepped in and cause the major indices to drift lower throughout the day. The S&P 500 Index ($SPX) surrendered an early 0.8% gain to finish unchanged. Both the Nasdaq Composite ($COMPX) and Dow Jones Industrial Average ($DJIA) edged 0.1% lower. The bright spot of the day was a bit of relative strength exhibited by small and mid-cap stocks. The Russell 2000 Index ($RUT) and S&P Midcap 400 Index ($MID) managed to gain 0.4% and 0.5% respectively. Nevertheless, as has been the trend lately, all the main stock market indexes again closed at their intraday lows.
Total volume in the NYSE ticked 7% higher, but turnover in the Nasdaq eased 11%. Although the broad market trended lower throughout the day to finish with mixed results, market internals remained positive. In the NYSE, advancing volume exceeded declining volume by a margin of just over 2 to 1. The Nasdaq ADV/DEC volume ratio was positive by 3 to 2. The positive volume spread tells us there were at least pockets of buying in the market yesterday, which was confirmed by the relative strength in small and mid-cap stocks.
For the third straight day, our open ETF positions performed well as the broad market showed weakness. The standout of the day was US Natural Gas Fund ($UNG), which zoomed 4.4% higher yesterday. More importantly, the commodity ETF broke out above its consolidation to a new “swing high.” Volume also rose above its 50-day average level, which confirmed the upward move. The daily chart pattern of UNG is now positioned for another leg higher within its intermediate-term uptrend that became established after the ETF formed two “higher highs” and two “higher lows” over the summer. Yesterday’s breakout in UNG is shown on the daily chart below:

Our position in First Trust Natural Gas Index ($FCG) gained 1.8% yesterday, and on solid volume, but the ETF has yet to break out above its tight, sideways trading range. What seems to be happening is that FCG is attempting to rally alongside of the strength in UNG, but the weakness in the overall broad market has been holding its advance in check. This is because the portfolio of FCG is comprised of individual stocks, rather than being tied to the price movement of an actual commodity. Still, FCG has been showing considerable relative strength to the broad market because it has been merely moving sideways while the major indices have been falling for the past five days. This is a good sign because it means that FCG will likely breakout and surge higher as soon as we see a bounce in the broad market. If an ETF is exhibiting relative strength by holding steady while the overall stock market falls, it usually will rally as soon as selling pressure on the overall stock market abates. As such, we continue to hold FCG with the same stop price. The tight band of consolidation on FCG is shown below:

The poorest performer of the main stock market indexes yesterday was the Nasdaq 100 Index. For us, however, this was a good thing because we remain short the index through being long the inversely correlated ProShares Short QQQ ($PSQ). In yesterday’s commentary, we pointed out that the major problem with the Nasdaq 100 right now is the relative weakness in $AAPL. Specifically, we said, “It may be difficult for the Nasdaq to find traction if $AAPL is unable to hold the low of the October 9 reversal candle.” Falling 1.9% yesterday, AAPL was indeed a drag on the Nasdaq, but the stock is still holding above the intraday low of its October 9 bullish reversal candle.
Using PowerShares QQQ Trust ($QQQ) as an ETF proxy for the Nasdaq 100 Index, notice on the chart below that QQQ formed a candlestick pattern known as bearish engulfing. This occurs when the price opens above the previous day’s high, but falls all the way to close below the previous day’s low. It’s obviously a negative pattern that usually points to further near-term downside. However, given that QQQ has now registered a loss for five consecutive days, it could easily bounce off its lows before potentially making another leg lower. We have highlighted the bearish engulfing candlestick pattern on the daily chart of QQQ below:

Going into today’s session, note that we have tightened the stop in PSQ to the breakeven level. Although we are willing to sit through a small bounce in anticipation of another leg down before taking profit, we are not willing to take a loss on the trade in the event of a sudden short squeeze in the market. By tightening our stop, we have now removed all the risk from the trade so that we can let it play out without concern of a loss. We will continue monitoring the price action of QQQ/PSQ closely, and will continue squeezing the stop further to lock in any gains as the price action allows.
Our swing trade setup in Proshares Ultra Silver ($AGQ) triggered for buy entry when it moved above the three-day high yesterday, but the ETF reversed later in the day and drifted back down to a small loss. It was not encouraging price action, but we will maintain the same stop price for now. Our only other open ETF position, iShares Colombia Index ($GXG), is not doing much of anything right now. We’re only holding one quarter position size of GXG, but we can always add to the trade IF it manages to move back up to break out above its recent range.
With our market timing model still in “neutral” mode, we are not in a hurry to enter any new ETF trades that have a close correlation to the direction of the stock market (basically all stock ETFs). However, we continue building an internal watchlist of the next potential trading opportunities for after the broad market decides whether the current pullback off the highs will be short-lived, or will eventually turn into a new intermediate-term downtrend. We will be prepared either way.
stock commentary:
The following stocks have broken down within the past few weeks and are no longer on our top internal watchlist: QCOR THLD SWKS EW STX SPR FIRE ISIS ATHN CLUB ROST ACAT Z FEIC RTN TSO ACOM FTNT WDC RGR AIRM.
Potential setups we are monitoring: QIHU ASGN PCRX REGN NTE FLWS CRAY GNRC SYMBL LULU KORS URBN CTRX LOPE PVH VRX VSI
Before we attempt to grab some long exposure we’d like to see the market settle down for a few days and eventually put in a higher volume accumulation day. Patience is key right now, as we wait for clear, low-risk buy setups to emerge. If the market rallies off the swing lows on weak volume and setups do not improve, then we may have to establish a few short positions as the market could be vulnerable to another wave of selling.
If you are a new subscriber, please e-mail [email protected] with any questions regarding our trading strategy, money management, or how to make the most out of this report.
relative strength combo watchlist:
Our Relative Strength Combo Watchlist makes it easy for subscribers to import data into their own scanning software, such as Tradestation, Interactive Brokers, and TC2000. This list is comprised of the strongest stocks (technically and fundamentally) in the market over the past six to 12 months. The scan is updated every Sunday, and this week’s RS Combo Watchlist can be downloaded by logging in to the Members Area of our web site.