Current buy signal was generated on the close of June 13
Past signals:
Neutral signal generated on close of June 12
Buy signal generated on the close of April 30
today’s watchlist (potential trade entries):

Having trouble seeing the open positions graphic above? Click here to view it directly on your web browser instead.
open positions:
Below is an overview of all open positions, as well as a report on all positions that were closed only since the previous day’s newsletter. Net P/L figures are based a $100,000 model portfolio. Changes to open positions since the previous report are listed in pink shaded cells below. Be sure to read the Wagner Daily subscriber guide for important, automatic rules on trade entries and exits.

Having trouble seeing the open positions graphic above? Click here to view it directly on your web browser instead.
closed positions:

Having trouble seeing the closed positions graphic above? Click here to view it directly on your web browser instead.
ETF position notes:
- No setups triggered
stock position notes:
- No setups triggered
ETF, stock, and broad market commentary:
Stocks rallied across the board ahead of Wednesday’s Fed meeting on mixed volume. The NASDAQ climbed 0.9% on a slightly higher volume, while the S&P 500 rallied 0.8% on slightly lower volume. Small cap stocks led the way with a 1.2% gain in the Russell 2000.
The Fed will release its decision on rates tomorrow afternoon, so as usual, we can expect a pick up in volatility in the final 90 minutes of trading. For those who trade the plan and come in prepared, Fed days are not such a big deal. However, for some traders, the last 90 minutes of trading on a Fed day can turn in to a roller coaster ride. Emotional based decision making hardly ever works, so we always recommend planning the trade in advance and sticking to that plan during the day.
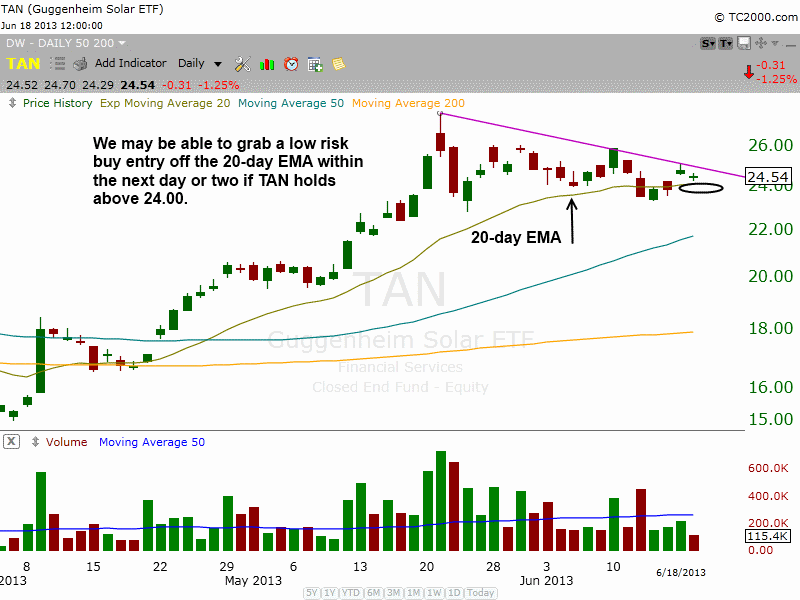
Guggenheim Solar ETF ($TAN) remains on our watchlist, but we are monitoring the action for a potential pullback entry if it can hold support at the 20-day EMA around $24.

Ideally, we’d like to see $TAN dip below the 20-day EMA for a few hours and close back above to form a bullish reversal candle. If we are unable to locate a low risk pullback entry over the next day or two that is fine, as we still have buy stop order that should trigger on a break of the downtrend line.
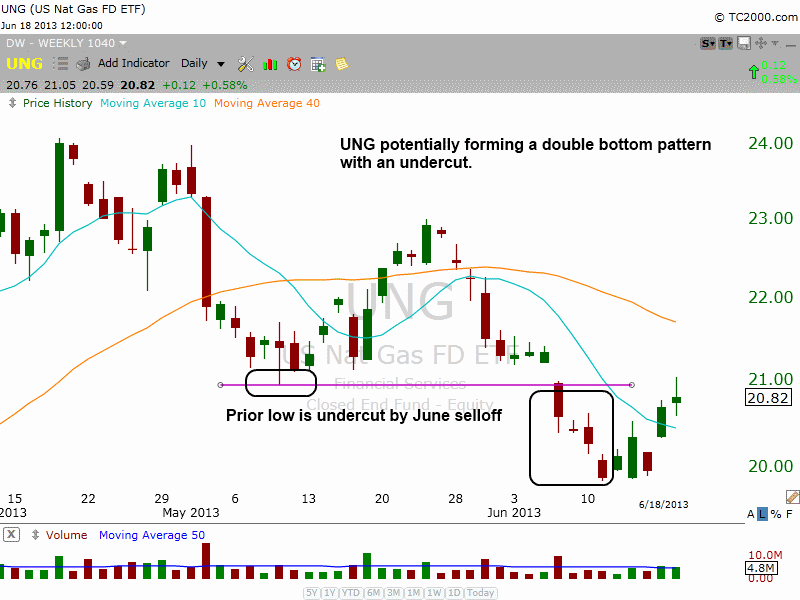
After breaking down below support of the prior swing low and dipping below the 200-day MA for a few days, United States Natural Gas ETF ($UNG) rallied off the lows and closed above the 200-day MA yesterday.

$UNG may be forming a bullish double bottom pattern if it can hold the 200-day MA and push higher next week. If so, the first higher swing low that holds at or above $21 could provide us with a low risk entry point for partial size.
For those of you wondering how we can label $UNG as a double bottom if the lows are not equal please see the chart below:
Double Bottom Chart Patterns

While most traders who have read books on technical analysis know of the conventional double bottom, where both lows are about equal, the double bottom we prefer to trade is one where the stock/ETF undercuts the prior swing low and reverses higher. This undercut of the prior swing low usually scares away most longs and triggers a ton of sell stops. Now the key to this pattern is the price action recovering quickly above the prior swing low (in $UNG that level is $21). If $UNG sits below $21 for too long (more than a few weeks), then it is no longer a shakeout….it then becomes an ETF making lower highs and lower lows (a downtrend).
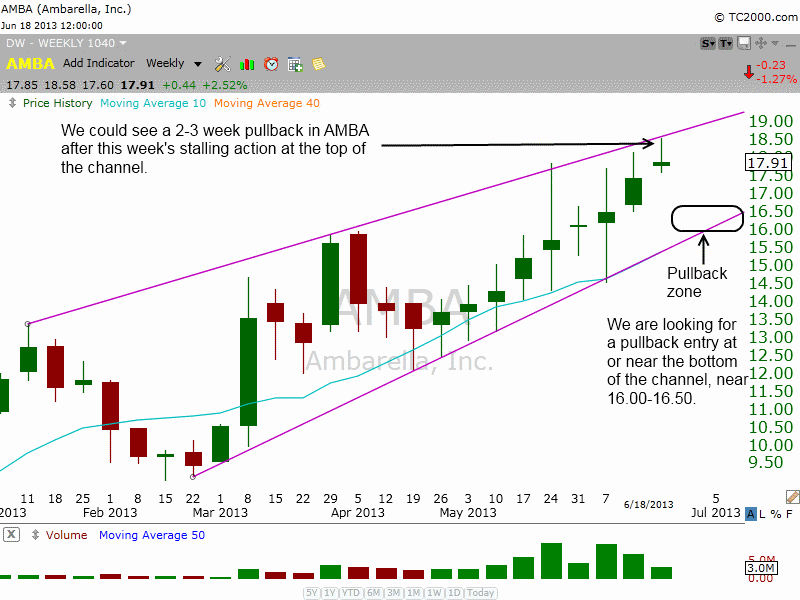
On the stock side, $AMBA stalled out for the second time in two weeks above $18. The stalling action suggests that a short-term pullback may be in order late this week or next week. The channel drawn on the weekly chart below gives us a pretty clear idea of support and resistance.

A pullback to the lower uptrend line of the channel could provide us with a low risk entry point to add to our existing position (around $16 – $16.50). Any pullback off the high should hold above the rising 10-week MA.
$OSTK recovered once again from a morning selloff and rallied in to the close. We now have a stop in place for the full position beneath yesterday’s reversal candle low.
- $LLEN is holding up so far and could still work out but the price action must stay above the 20-day EMA in the short-term.We updated the Relative Strength Combo list this evening. Please note the new features on that list in the RS Combo guide below.