Current signal generated on close of January 24.
Portfolio exposure can be anywhere from 0% to 60% long (or more), depending on how open positions have held up the past three days.
Past signals:
- Buy signal generated on close of November 13
- Buy signal generated on close of September 9
- Neutral signal generated on close of August 15
- Buy signal generated on close of July 11
- Neutral signal generated on close of July 5
- Sell signal generated on close of June 24
today’s watchlist (potential trade entries):

Having trouble seeing the open positions graphic above? Click here to view it directly on your web browser instead.
Below is an overview of all open positions, as well as a report on all positions that were closed only since the previous day’s newsletter. Changes to open positions since the previous report are listed in pink shaded cells below. Be sure to read the Wagner Daily subscriber guide for important, automatic rules on trade entries and exits.

Having trouble seeing the open positions graphic above? Click here to view it directly on your web browser instead.
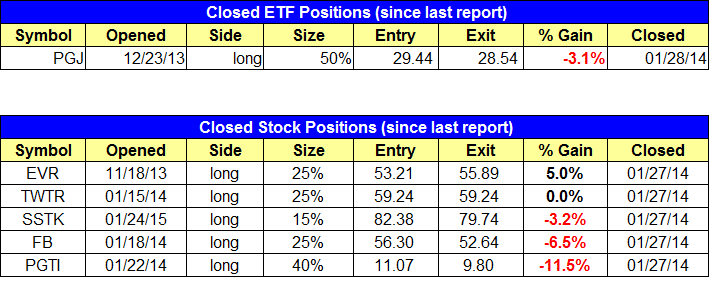
closed positions:
Having trouble seeing the closed positions graphic above? Click here to view it directly on your web browser instead.
ETF position notes:
- Stopped out of $PGJ
stock position notes:
- Stopped out of $PGTI, $FB(add), $SSTK(add), $TWTR, and $EVR.
ETF, stock, and broad market commentary:
Stocks followed through to the downside in the morning session before bouncing higher in the early afternoon. The bounce was strong enough to push the S&P 500 into positive territory briefly before selling off once again in the final hour of trading.
The Nasdaq Composite closed -1.1 lower, but the afternoon bounce allowed the index to finish well off the lows of the day and right at the 50-day MA. So the Nasdaq Composite remains the only index to hold the 50-day MA.
$AAPL was hammered in after-hours trading in reaction to earnings, finishing the session at $506, which is about 8% off Monday’s closing price. The ugly gap down could spark further selling on the open tomorrow in tech stocks.
“Everyone has a plan ’till they get punched in the mouth.” – boxing great Mike Tyson. The market has certainly thrown a few Tyson-like uppercuts the past three sessions, leaving most traders down for the count. We have tightened up stops on most open positions, and are prepared to hold on to a few of the better acting stocks with fairly loose stops as long as they act well.
Our timing model remains in neutral, but the leading stock portion of the model is barely hanging on. The same can be said for the trend portion, with the Nasdaq Composite in danger of losing the 50-day MA. Though some traders may feel the urge to pick a bottom in a favorite stock or ETF that was recently hit hard, market conditions have deteriorated so quickly that is best to lay low in the short-term.
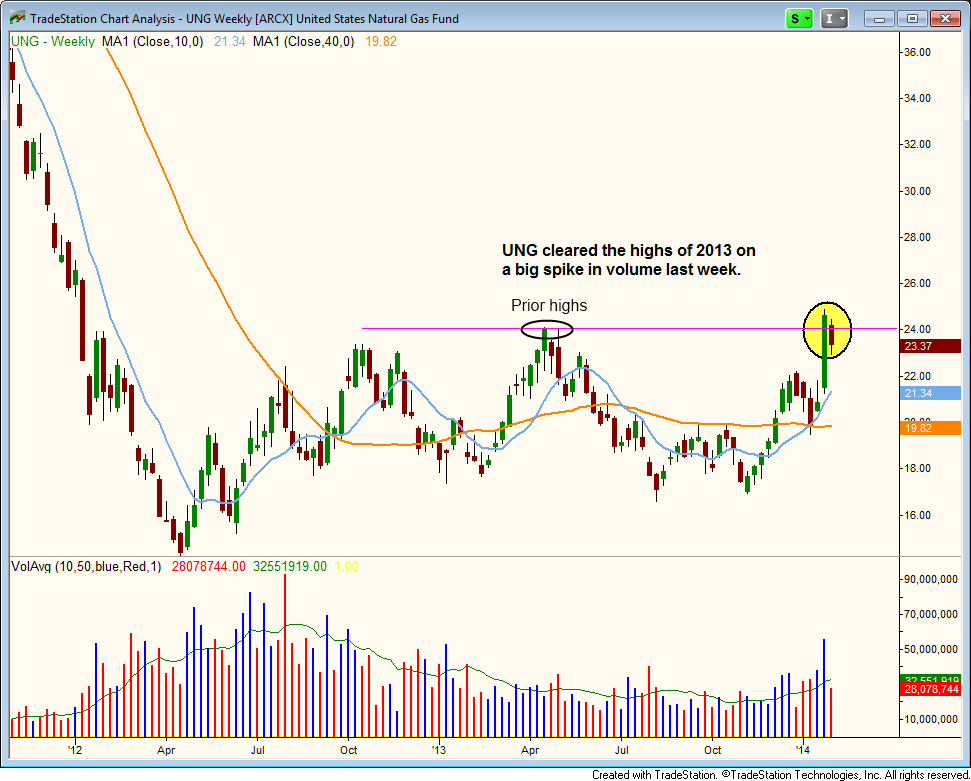
The recent breakout in the Natural Gas ETF ($UNG) is just about the only bullish price action we see from our scans. On the weekly chart below, $UNG cleared the prior highs of 2013 on big volume. The weekly price and volume action was impressive, and could potentially spark a strong rally after nearly two years of chop near the lows.
On the daily chart, $UNG pulled back in on Monday, which is to be expected at some point after a 25% run up off the lows in only eight sessions.
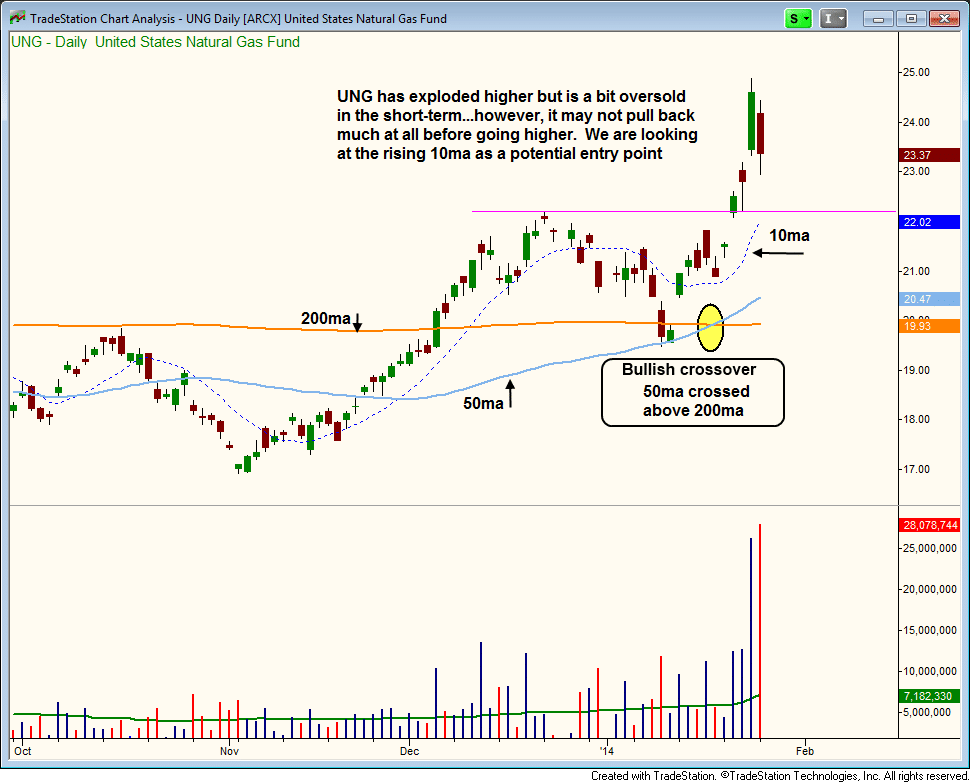
As the price action settles down and digests the last wave up, the 10-day MA should eventually catch up and provide support. A pullback to the 10-day MA might be all we get if the new uptrend is strong. Note that the 50-day MA has crossed above the 200-day MA and has been trending higher for a few months. The 200-day MA is still sideways, but did turn up slightly last week.
There is no official entry as of today, but we will continue to monitor the action for a low-risk entry point.
We tightened up the stop in half of $SEA, as the price action failed to hold above the last swing low at $21. We will still carry a loose stop on the remaining half, looking for the action to hold above the 50-day MA.
On the stock side, we have raised a few stops to protect gains and or limit losses. On the stocks that are acting well, we are basically leaving them alone. If our timing model shifts to an outright sell, we will continue to hold stocks that show great relative strength. However, if these stocks break down below key support levels we will be forced to sell.
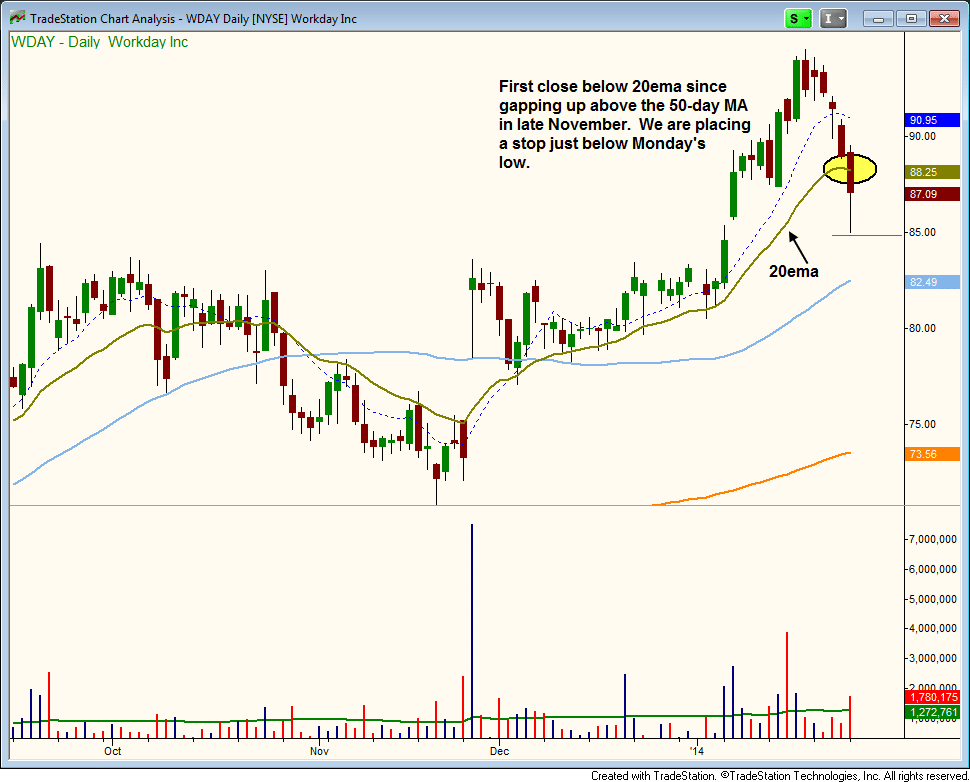
$WDAY closed below the 20-day EMA on volume yesterday. The close was a sell signal for us, but we are placing the stop beneath yesterday’s low. We will look to ditch the position into strength if we see a 2-3 day bounce.