Current signal generated on close of July 11.
Portfolio exposure should at least be 75% to 100% long or more (if you can go on margin).
Past signals:
- Neutral signal generated on close of July 5
- Sell signal generated on close of June 24
today’s watchlist (potential trade entries):

Having trouble seeing the open positions graphic above? Click here to view it directly on your web browser instead.
open positions:
Below is an overview of all open positions, as well as a report on all positions that were closed only since the previous day’s newsletter. Changes to open positions since the previous report are listed in pink shaded cells below. Be sure to read the Wagner Daily subscriber guide for important, automatic rules on trade entries and exits. Click here to learn the best way to calculate your share size.

Having trouble seeing the open positions graphic above? Click here to view it directly on your web browser instead.
closed positions:
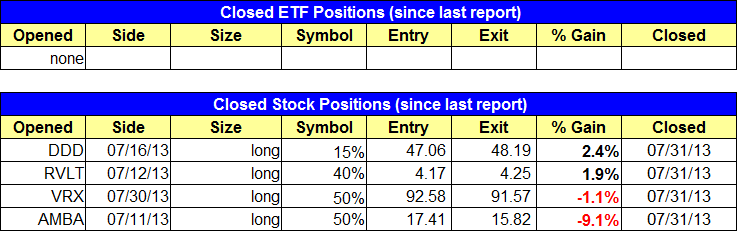
Having trouble seeing the closed positions graphic above? Click here to view it directly on your web browser instead.
ETF position notes:
- No setups triggered
stock position notes:
- Sold all of $AMBA, $VRX, and $RVLT. Sold half of remaining position in $DDD.
ETF, stock, and broad market commentary:
A volatile and indecisive session of trading led to mixed results yesterday, as investors began digesting the latest update on monetary policy from the Federal Reserve Board. The NASDAQ Composite edged 0.3% higher, while the blue-chip Dow Jones Industrial Average slipped 0.1%. The benchmark S&P 500 Index was unchanged.
As is often the case on Fed days, turnover swelled across the board. Total volume in the NYSE increased 18%, while volume in the NASDAQ was 9% higher than the previous day’s level. Although the NASDAQ technically closed higher and on higher volume, it would be a stretch to label yesterday as a bullish “accumulation day” because the index made little headway AND closed at its intraday low. More accurately, yesterday was another session of “churning.”
In the July 30 issue of The Wagner Daily, we said, “The First Trust ISE Revere Natural Gas ETF ($FCG) hasn’t done much at all this year but chop around in a tight range. However, looking at the monthly chart, we see that the current consolidation is just below the monthly downtrend line.” Here was the chart we showed at the time:

Yesterday, after gaining 0.6%, $FCG is now within striking distance of breaking out above its high of the past several weeks. If it does, we plan to buy it in anticipation of bullish momentum carrying it substantially higher in the near-term. The first buy will be on reduced share size, as we wait for confirmation in the form of a weekly breakout to add to the position.
Unlike $USO, which is a commodity ETF that tracks the price of crude oil, note that $FCG is NOT actually a commodity ETF. Rather than tracking the price of natural gas, it tracks the price of a basket of individual stocks related to the natural gas industry.
Although our ETF and stock picking strategy is based on the performance of leading individual stocks and ETFs, rather than the broad market, we like to keep an eye on the chart patterns of the major indices because they are commonly followed by the general public.
If an index such as the Dow Jones bumps into a resistance level, it sometimes causes temporary selling pressure on the broad market because investors and traders see that resistance and sell into it. In this regard, the support or resistance levels of the major indices often become a self-fulfilling prophecy.
Right now, the charts of two very popular indexes, the S&P 500 and NASDAQ 100, or at pivotal “make it or break it” levels that could have a significant impact on the near-term direction and momentum of the broad market.
Below are daily charts of the S&P 500 SPDR ($SPY) and PowerShares QQQ Trust ($QQQ), two popular ETF proxies that track the S&P 500 Index and Nasdaq 100 Index respectively. Notice how both indexes are toying with pivotal resistance levels of their recent highs:


Again, to reiterate, we will continue to manage our existing positions and enter new positions based on individual price action, rather than whether or not the major indices break out from here. Nevertheless, it’s always a good idea to keep an eye on the “big picture” of what’s going on in the market because of the self-fulfilling prophecy effect we mentioned earlier.
$SLCA reported earnings after the close, and finished around 22.30 in after hours trading. As long as $SLCA holds the 50-day MA we should be in good shape.
Please note that we reverted back to the original stop in $TUMI to give the setup a little more breathing room (we were too quick to raise the stop).
We have one new buy setup in Athenahealth – $ATHN:
The weekly chart below details the breakout action to new highs.

After the big volume gap up on July 12, $ATHN has been consolidating in a right range on ligher than average volume. The price action rallied above the high of 7/26 on Wednesday, but failed to follow through. We plan to enter if the price action can push back through the 7/26 high, with a stop beneath the 7/19 low. $ATHN has a decent RS ranking of 82 and a solid EPS ranking of 89. Its industry group ranking is 19 out of 197, and there are several stocks within the group that are acting well.

The RS+EPS Combo list was updated today.