market timing model: BUY
Current signal generated on close of November 13.
Portfolio exposure can be anywhere from 50 to 100% long. If positions are holding up well, then one can add exposure beyond 100%.
Past signals:
- Neutral signal generated on close of November 6.
- Buy signal generated on close of September 9
- Neutral signal generated on close of August 15
- Buy signal generated on close of July 11
- Neutral signal generated on close of July 5
- Sell signal generated on close of June 24
today’s watchlist (potential trade entries):

Having trouble seeing the open positions graphic above? Click here to view it directly on your web browser instead.
open positions:
Below is an overview of all open positions, as well as a report on all positions that were closed only since the previous day’s newsletter. Changes to open positions since the previous report are listed in pink shaded cells below. Be sure to read the Wagner Daily subscriber guide for important, automatic rules on trade entries and exits.

Having trouble seeing the open positions graphic above? Click here to view it directly on your web browser instead.
closed positions:
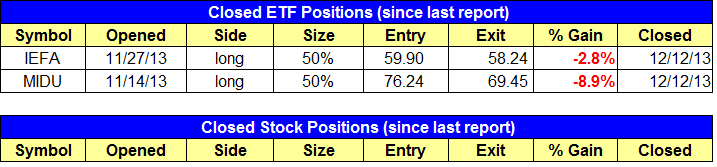
Having trouble seeing the closed positions graphic above? Click here to view it directly on your web browser instead.
ETF position notes:
- $IEFA stop triggered and we are out. $MIDU sell stop triggered due to gap down from $3 dividend. If you still own, please continue to hold with a stop of 69.87, at least through the 16th of December to receive the dividend.
stock position notes:
- We are taking small position in $CREG if it triggers due to light volume.
ETF, stock, and broad market commentary:
Stocks traded in a narrow range yesterday, closing mixed with the Dow Jones and S&P 500 down -0.4% and -0.7% respectively. The Dow Jones was the only major average to truly follow through to the downside, as the other averages basically chopped around near Wednesday’s low.
It certainly wouldn’t take much of a selloff to bring the S&P 500 to the rising 50-day MA, which would be fine with us as long as the selling does not produce a strong distribution day. The NASDAQ Composite is in better shape, as it has support from the prior breakout level and the 20-day EMA.
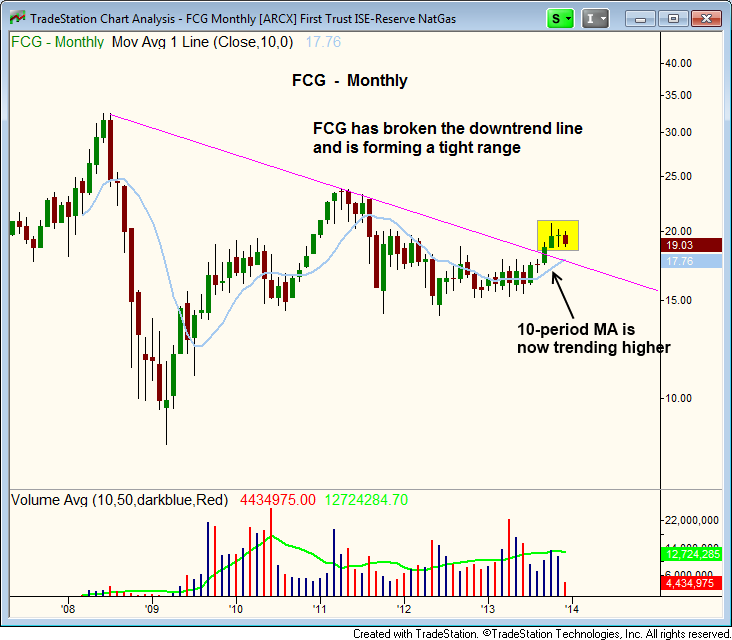
After breaking the monthly downtrend line, First Trust ISE Revere Natural Gas ($FCG) stalled out just above $20 and is now in basing mode. Note that the 10-month MA (which is like a 200-day MA) is clearly trending higher after six months of consolidation.
The daily chart shows the basing action over the past few months, with $FCG currently attempting to hold the prior swing low. The pattern has a bit more work to do as the 20-day EMA is below the 50-day MA. Usually when a stock or ETF is ready to move higher from a base the 20-day EMA is above the 50-day MA and both averages are pointing higher.
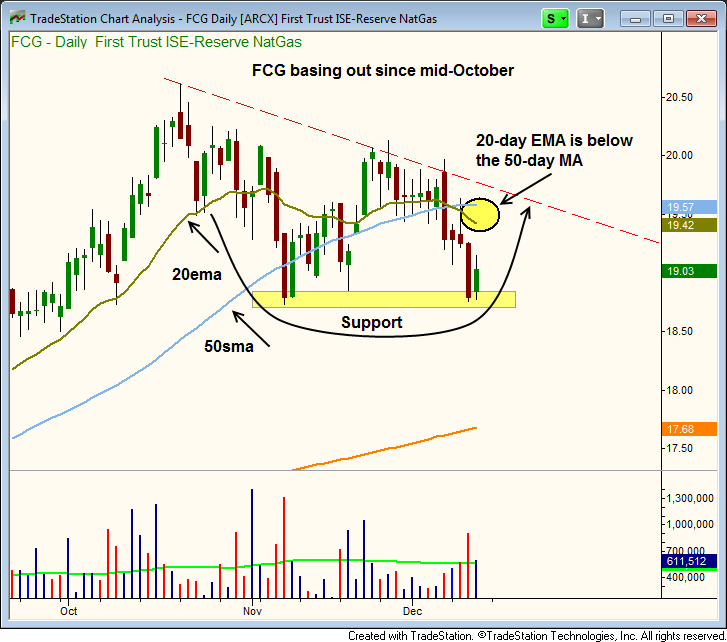
The setup is not actionable as of yet, but we will continue to monitor the action for a low risk buy entry.
Power Shares Golden Dragon China ($PGJ) has been in base mode since mid-October, and is trying to hold the 50-day MA. Wednesday’s shakeout was ugly, but if the price action can return back above the 50-day MA within the next day or two, then the drop was just a bullish undercut.
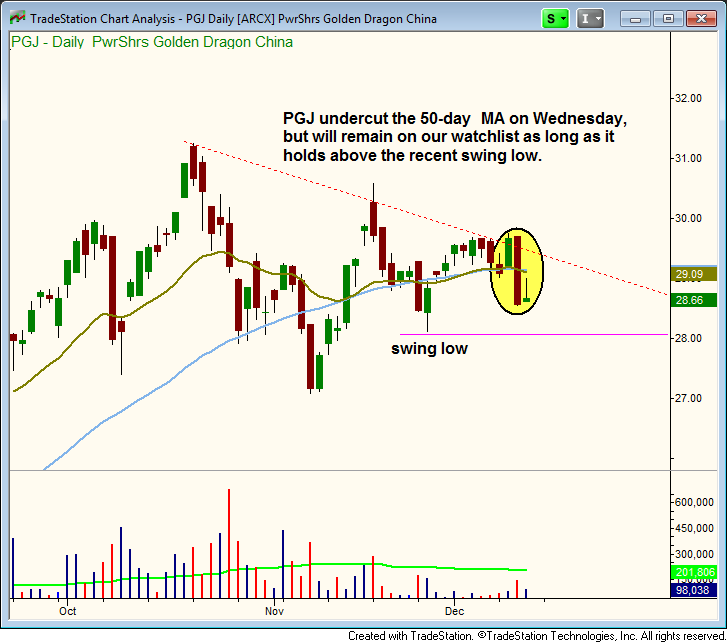
We are placing $PGJ on today’s watchlist (see trade details above).
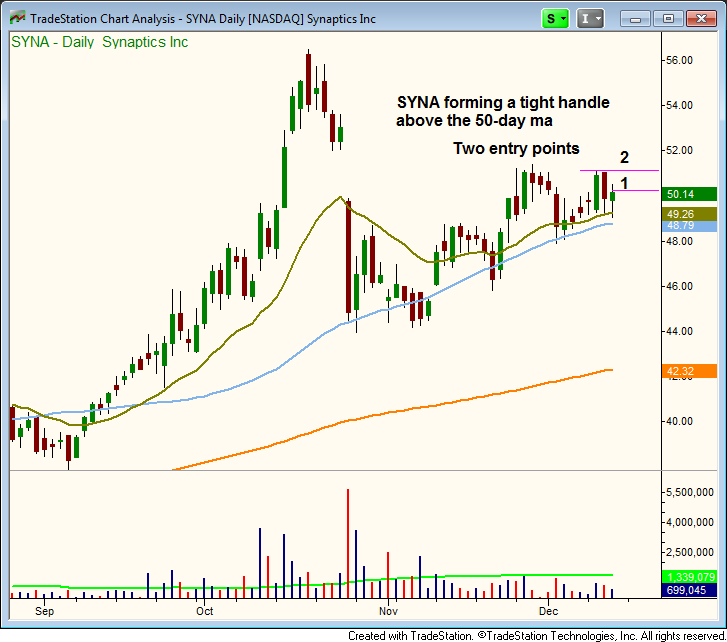
After an ugly selloff from the highs, $SYNA has really cleaned up as of late and is now trading in a right range above the 50-day MA.
$SYNA is an A rated setup, with a solid relative strength ranking of 90 and an earnings per share ranking of 94. This is a trade we would be willing to sit with for a few months IF the action remained strong.
We have two entry points in $SYNA. The first entry is basically almost an entry at market over yesterday’s close. The 5-minute rule will not apply to this entry. We are adding over the three day high, as that should eventually lead to a breakout of the range (the 5-minute rule will apply to the second entry).
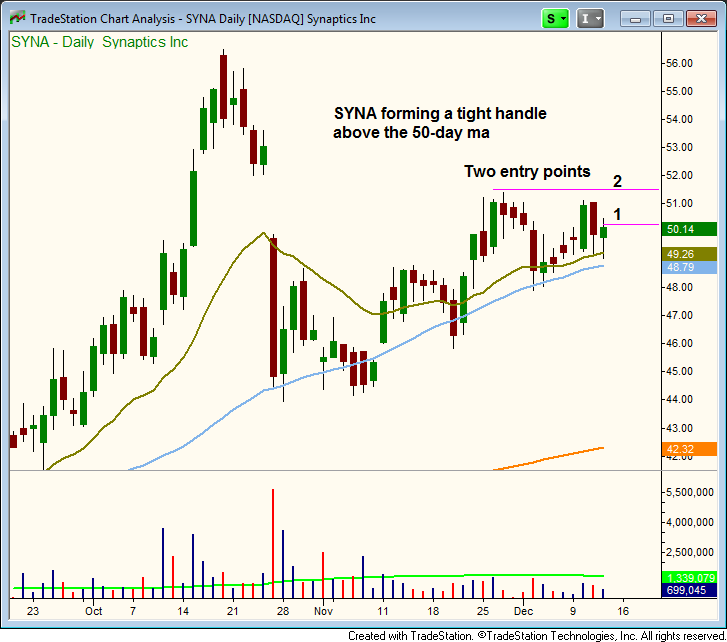
We also like the monthly chart of $SYNA, which has recently broken out to new all-time highs, so there are only clear blue skies above.