market timing model: Buy
Current signal generated on close of September 9.Portfolio exposure can be anywhere from 50% to 100% long depending on how individual setups are holding up. When the broad market averages pull back in (like the Russell has as of late) it’s usually a good time to establish new entries if bullish setups are available. Remember, to add more exposure, existing positions must be extending higher from original buy points. Do not add new positions if your first 3-5 selections are not making much progress at all.Past signals:
- Neutral signal generated on close of August 15
- Buy signal generated on close of July 11
- Neutral signal generated on close of July 5
- Sell signal generated on close of June 24
today’s watchlist (potential trade entries):

Having trouble seeing the open positions graphic above? Click here to view it directly on your web browser instead.
open positions:
Below is an overview of all open positions, as well as a report on all positions that were closed only since the previous day’s newsletter. Changes to open positions since the previous report are listed in pink shaded cells below. Be sure to read the Wagner Daily subscriber guide for important, automatic rules on trade entries and exits.

Having trouble seeing the open positions graphic above? Click here to view it directly on your web browser instead.
closed positions:

Having trouble seeing the closed positions graphic above? Click here to view it directly on your web browser instead.
ETF position notes:
- No trades were made.
stock position notes:
- $MDCO buy entry triggered and we are long.
ETF, stock, and broad market commentary:
Stocks opened lower across the board, but found traction during the first hour of trading and pushed higher the rest of the session. Although most broad based averages finished in negative territory, the closing prices were well off the lows of the session, so we view the action as mostly bullish.
All the major averages remain in a pretty tight trading range except for the Russell 2000, but so far the pullback has been constructive, finding support at the rising 20-day EMA.
Buy setups in $FAS and $SKYY remain on our ETF watchlist. We are adding one new buy setup to today’s watchlist in WisdomTree International SmallCap Dividend ETF ($DLS)
After breaking out from its last base at $58, $DLS found support at the rising 20-day EMA after a slight three-day undercut of the average. $DLS has once again pulled back to and undercut the 20-day EMA, where there is also support from the 38.2% Fibonacci level and the prior swing high of the last short-term consolidation.
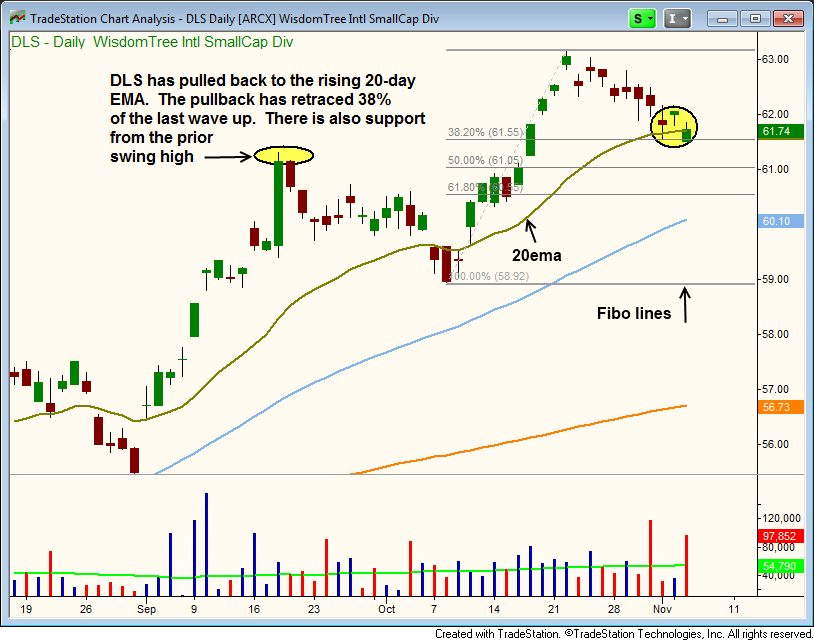
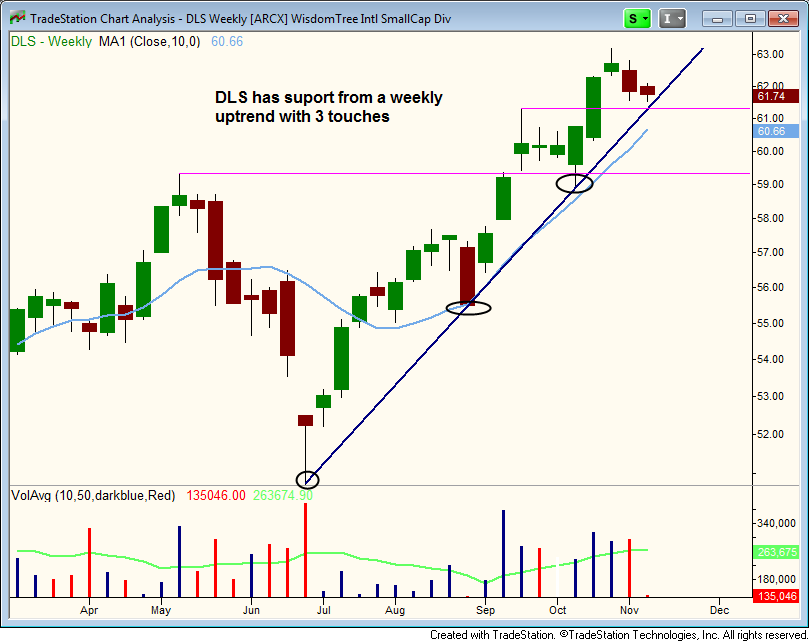
On the weekly chart, there is support from a weekly uptrend line with at least three touches. Please see the watchlist section above for trade details.
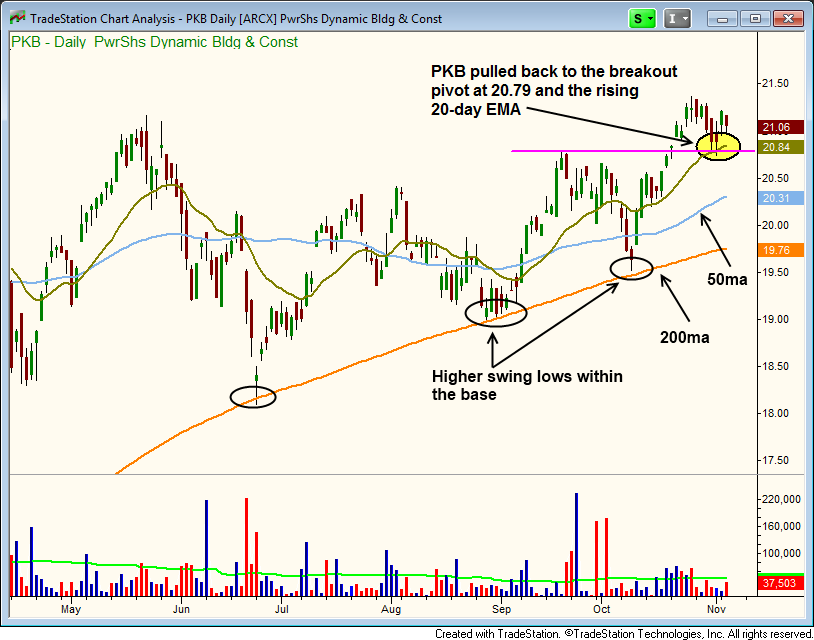
Although the homebuilders have lagged the broad market averages for several months, the PowerShares Dynamic Building & Construction ETF ($PKB) recently broke out to new highs before pulling back into the 20-day EMA and the breakout pivot a few days ago.
The chart below shows the six-month long base with higher swing lows finding support at the rising 200-day MA. Most of the basing patterns we like to buy are much shorter in length and for the most part hold above the 50-day MA. However, with basing patterns that are longer than five to six months or longer, it is normal to see a pullback to the 200-day MA. These longer setups are fine as long as the moving averages are still trending higher and are in proper order, with the 20ema > 50ma > 200ma.
On the stock side, our $MDCO buy entry triggered and closed near the highs of the day on a pick up in volume.
$TSLA and $MELI both reported earnings after the close on Tuesday, and both reactions were negative. $TSLA and $MELI dropped 11% and 8% respectively in after hours trading. However, it is still possible that the price action can recover during the pre-market session on Wednesday and open to much higher prices. Our stops are in, so all we can do is wait and see what happens.
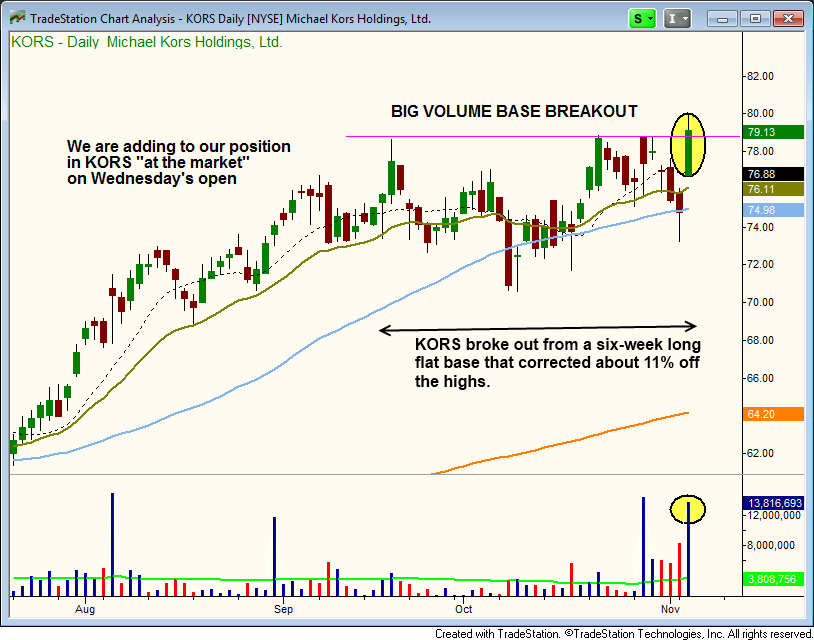
We are adding to our position in $KORS due to yesterday’s big volume breakout in reaction to earnings. $KORS is breaking out from a six week long base that only retraced about 11% off the highs. This shallow, sideways correction is known as a flat base.
We plan to buy a 25% position “at the market” on the open provided that the open is no greater than $80.40. If $KORS opens above $80.40 the setup is to be canceled.