market timing model:
Neutral – Signal generated on the close of August 2 (click here for more details)
today’s watchlist (potential trade entries):

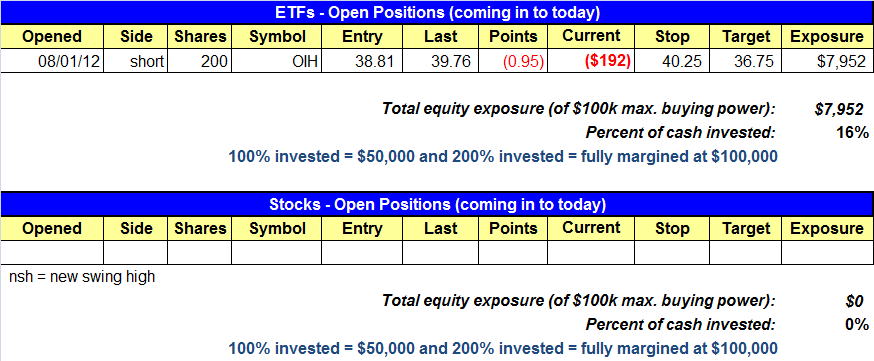
open positions:
Below is an overview of all open positions, as well as a report on all positions that were closed only since the previous day’s newsletter. Net P/L figures are based on two separate $50,000 model portfolios (one for ETFs and one for stocks). Changes to open positions since the previous report are listed in red shaded cells below. Be sure to read the Wagner Daily subscriber guide for important, automatic rules on trade entries and exits.

Having trouble seeing the open positions graphic above? Click here to view it directly on your web browser instead.
closed positions:

Having trouble seeing the closed positions graphic above? Click here to view it directly on your web browser instead.
ETF position notes:
- Removed XME from the watchlist.
stock position notes:
- No trades were made.
ETF and broad market commentary:
Friday was a strong day for Wall Street. Stocks gapped up and surged higher throughout the session. However trade was light. All five major indices ended near intraday highs. High beta issues led the charge higher. The small-cap Russell 2000 tacked on an impressive 2.6%, while both the S&P MidCap 400 and the Nasdaq tacked on 2.0%. The S&P 500 improved by a solid 1.9% and the Dow Jones Industrial Average added 1.7%. It is noteworthy that both the QQQ and SPY set new swing highs on Friday. If this price action holds, a retest of the May swing high on both indices could soon occur.
Despite the strong price action in the market on Friday, internals ended the session mixed. Volume dropped on the Nasdaq by 5.5% and on the NYSE by almost 10.0%. Still, advancing volume topped declining volume on both exchanges. On the NYSE, the ratio of advancing volume to declining volume ended the session at 9.3 to 1 and on the Nasdaq, it finished at 4.7 to 1. The light volume suggests that institutions were not particularly active on Friday. This is somewhat surprising given the magnitude of the move.
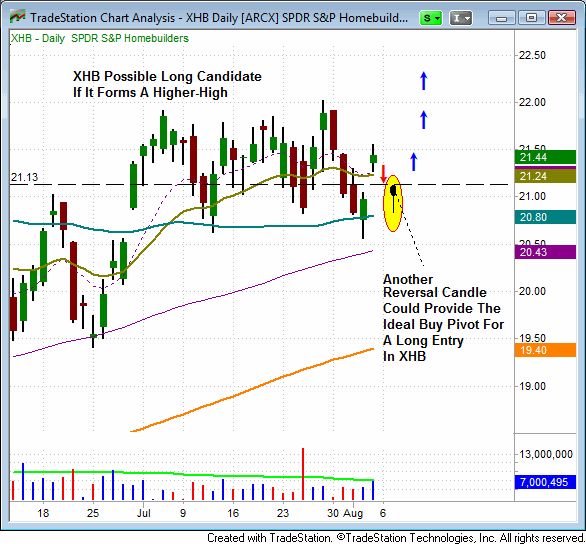
The SPDR S&P Homebuilders ETF (XHB) has been one of the strongest ETFs in the market over the past several months. Last Thursday XHB formed a bullish reversal candle which was followed by Friday’s gap up. Although this price action is bullish, it does not provide an entry suitable to taking on the trade. In order for XHB to provide a quality buying opportunity we would like to see it set a “higher-low” and another “buy-pivot” similar to the reversal candle formed last Thursday. Under these circumstances we would consider XHB a potential buy entry over the new pivot.

Based on Friday’s price action, we are canceling the XME setup. XME still provides a potential shorting opportunity. However, in the wake of yesterday’s price action, it is now possible that a better setup could present itself. Our short position in OIH was put under significant pressure on Friday, as it narrowly escaped hitting its stop. OIH closed in the middle of its intraday range and the trade still remains intact. For the most part, yesterday’s market action was quite bullish and should continue to place pressure on market bears on Monday. However, it is of some concern that the market couldn’t generate enough buying interest to post an accumulation day.
stock commentary:
It’s tough to get excited about Friday’s percentage gains when volume was so light. We’ll continue to lay low and wait for better setups to emerge as we are in no rush to establish new positions. That being said, we take the market one day at a time and a lot can change in a few days.
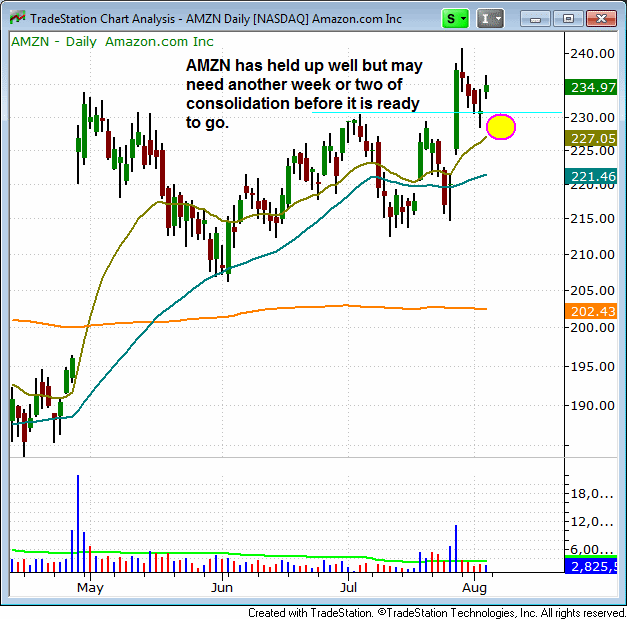
AEO, AAPL, AMZN, EQIX, VAC, REGN, PCYC, AUTH, ONCC, and MLNX are a few stocks we are monitoring. The daily chart of AMZN below shows a strong basing pattern that could be ready to move higher within the next few weeks IF market conditions improve (the chart below is not an official setup).

If you are a new subscriber, please e-mail [email protected] with any questions regarding our trading strategy, money management, or how to make the most out of this report.
relative strength combo watchlist:
Our Relative Strength Combo Watchlist makes it easy for subscribers to import data into their own scanning software, such as Tradestation, Interactive Brokers, and TC2000. This list is comprised of the strongest stocks (technically and fundamentally) in the market over the past six to 12 months. The scan is updated every Sunday, and this week’s RS Combo Watchlist can be downloaded by logging in to the Members Area of our web site.