market timing model:
Sell – Signal generated on the close of October 12 (click here for more details)
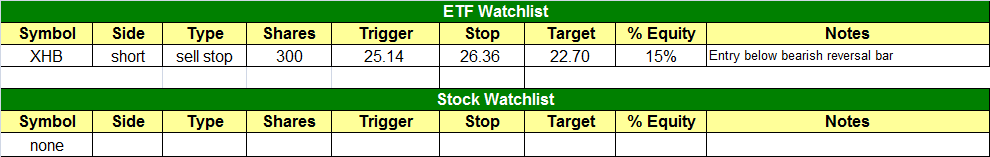
today’s watchlist (potential trade entries):
Having trouble seeing the open positions graphic above? Click here to view it directly on your web browser instead.
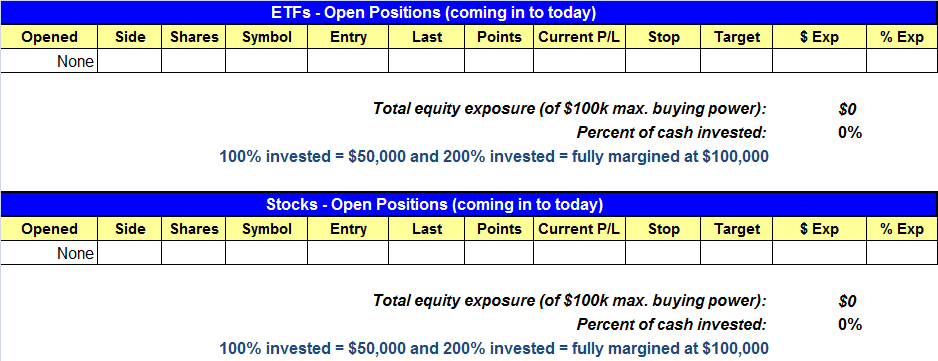
open positions:
Below is an overview of all open positions, as well as a report on all positions that were closed only since the previous day’s newsletter. Net P/L figures are based on two separate $50,000 model portfolios (one for ETFs and one for stocks). Changes to open positions since the previous report are listed in pink shaded cells below. Be sure to read the Wagner Daily subscriber guide for important, automatic rules on trade entries and exits.
Having trouble seeing the open positions graphic above? Click here to view it directly on your web browser instead.
closed positions:

Having trouble seeing the closed positions graphic above? Click here to view it directly on your web browser instead.
ETF position notes:
- No trades were made.
stock position notes:
- No trades were made.
ETF and broad market commentary:
As anticipated, stocks followed through on the bullish hammer formations we discussed in yesterday’s newsletter, causing the broad market to finally score a substantial round of gains. The Nasdaq, S&P 500, and Dow Jones surged an average of 2.0% higher. Like the previous day, small and mid-cap stocks showed a bit of relative strength and gained slightly more. Although the stock market’s sizable advance was impressive, a majority of the gains were the result of the major indices gapping higher on the open. Thereafter, stocks grinded sideways to higher before closing near their intraday highs.
Unfortunately for the bulls, yesterday’s rally lacked the punch of institutional accumulation. Total volume in the NYSE and Nasdaq was 25% and 20% lighter than the previous day’s levels respectively. This tells us that banks, mutual funds, hedge funds, and other institutions were not active participants in yesterday’s rally. After weeks and weeks of steady downward pressure, it would be fair to refer to yesterday’s session merely as a relief rally from oversold conditions, which was likely driven by traders covering their short positions, as well as hopeful retail traders who were (dangerously) trying to catch the bottom.
Over the past several days, we have been clearly explaining that our current plan of action is to wait for the weakest ETFs and stocks to bounce into significant technical resistance levels, such as moving averages and prior lows, and then wait for the bearish reversal patterns as a signal to initiate new short positions (and/or buy inversely correlated “short ETFs”). As such, we were pleased with yesterday’s rally because it puts us closer to getting back into the market with new swing trades (albeit likely on the short side).
Given yesterday’s large percentage gains, the current bullish momentum could easily cause stocks to move higher for at least another week or two before the bears return to the market, causing the established downtrend to start taking hold again. Nevertheless, it’s important to remember that the stock market is very dynamic. For example, the sudden presence of an “accumulation day” (higher volume gains), followed by a confirmation day in which stocks jump another 1.5% to 2% at least three to four days later, could actually generate a new “buy” signal in our market timing model. If that happens, no problem; we don’t care either way. Our winning swing trading system is based on trading either side of the market by simply reacting to current price action in front of us, rather than making predictions about market direction. Simply put, we trade what we see, not what we think!
In yesterday’s newsletter, we said we were looking for pullback re-entry points into our recent winning ETF trades ($SRS, $SMN, $SKF, and $TMF). We also said we were looking for new short entry points in non-inverse ETFs such $IBB and $QQQ. Yesterday’s rally was a good start, as the inverse ETFs we’re stalking for re-entry pulled back substantially, while the non-inverse ETFs conversely bounced sharply higher (approaching resistance). Still, none of these ETFs we have been discussing are near the levels where we would consider entering them just yet. However, we came across one ETF that actually is already set up for possible short entry in today’s session.
The SPDR S&P Homebuilders ETF ($XHB) was one of the last ETFs to break down below support during the recent decline, but now the ETF has a lot of immediate overhead supply and resistance to contend with. Just like many other stocks and ETFs, XHB jumped 2% higher yesterday. However, it formed a bearish reversal candlestick (similar to ashooting star candlestick) after running into resistance of both its 20-day exponential moving average and 50-day moving average. The ETF closed near its intraday low, and below both moving averages. This is shown on the daily chart of XHB below:

The setup for this swing trade is that we will only sell short XHB if it trades below yesterday’s low. This would provide us with a valid short entry point because its current relative weakness would indicate a resumption of downward momentum if that happens. Note that entering before a break of yesterday’s low is risky and not a valid short entry point. Because XHB formed a bearish reversal bar, it also makes it easy for us to clearly define our stop price, which is just above yesterday’s high (plus some “wiggle room”). An approximate downside target price would be a breakdown to a new swing low, which would also provide us with reward to risk ratio of approximately 2 to 1 for this trade setup. We are listing XHB as an “official” trade setup today, so please note our exact trigger, stop, and target prices on the ETF Watchlist section above. If you are new to short selling, or our specific short selling strategy, we recommend taking a quick look at this video on our trading blog.
If XHB triggers for short entry in today’s session, and you receive a notice from your online broker that “shares are unavailable for selling short,” we recommend phoning your broker and asking them to “locate” shares for borrowing. With some brokerage firms, their automated computer systems will say shares are not available, but they can often locate shares if you call and specifically ask them to do so. If that doesn’t work, consider switching to a brokerage firm with a more extensive list of shares available for short selling (TradeStation and Interactive Brokers are two that we recommend). Unfortunately, there is no inverse ETF for the homebuilder sector. The closest that exists is an inverse real estate ETF (SRS), but that’s not exactly the same chart pattern as XHB.
stock commentary:
With the market following through on Friday’s bullish reversal action, our short scans will need some time to produce low risk entry points. Although the timing model is in sell mode we must not fall in love with the short side, as there is the possibility that the current correction may not have much more downside. If after a few days of higher prices we see the market stall out and short setups emerge, then we will take a shot with a few more shorts.
Over the weekend we scanned our main long watchlist to see what charts were holding up the best. One of the best looking patterns out there was QIHU, which has excellent fundamentals and tight price action/relative strength. Check out the weekly chart of QIHU below. The first correction off the highs was a bid too deep at 47%. We prefer to see stocks correct about 20-30% off the highs. The current nine-week correction beginning in mid-September has only pulled a little over 20% off the high, so the price action has tightened up nicely.

On the daily chart we see that the 50-day MA (blue) has recently crossed above the 200-day MA (orange), which satifies the trend component of our scans for all buy candidates (except IPOs). We also like the drop off in volume during the correction. QIHU is one to keep an eye on when the market turns healthy.

In yesterday’s report, we incorrectly listed an indicator as the % of stocks below the 40-day moving average. It is actually the % of stocks above the 40-day moving average. When the percent of stocks above the 40ma dips in to the 10-20% range it signals oversold conditions.
If you are a new subscriber, please e-mail [email protected] with any questions regarding our trading strategy, money management, or how to make the most out of this report.
relative strength combo watch list:
Our Relative Strength Combo Watchlist makes it easy for subscribers to import data into their own scanning software, such as Tradestation, Interactive Brokers, and TC2000. This list is comprised of the strongest stocks (technically and fundamentally) in the market over the past six to 12 months. The scan is updated every Sunday, and this week’s RS Combo Watchlist can be downloaded by logging in to the Members Area of our web site.