market timing model:
Buy – Signal generated on the close of August 16 (click here for more details)
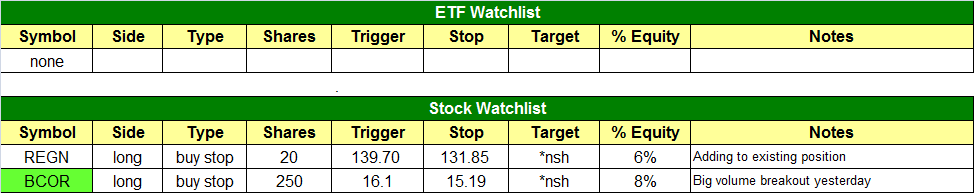
today’s watchlist (potential trade entries):
Having trouble seeing the open positions graphic above? Click here to view it directly on your web browser instead.
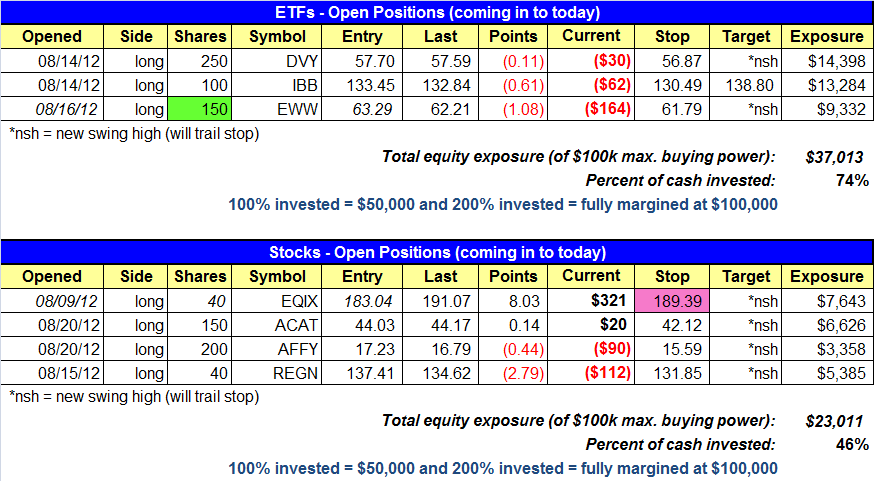
open positions:
Below is an overview of all open positions, as well as a report on all positions that were closed only since the previous day’s newsletter. Net P/L figures are based on two separate $50,000 model portfolios (one for ETFs and one for stocks). Changes to open positions since the previous report are listed in pink shaded cells below. Be sure to read the Wagner Daily subscriber guide for important, automatic rules on trade entries and exits.
Having trouble seeing the open positions graphic above? Click here to view it directly on your web browser instead.
closed positions:

Having trouble seeing the closed positions graphic above? Click here to view it directly on your web browser instead.
ETF position notes:
- EWW buy entry to add 100 shares triggered. We now have 150 shares total.
stock position notes:
- Raised the stop in EQIX.
- Cancelled the IACI setup for now and replaced it with BCOR.
ETF and broad market commentary:
A positive start to the day led to a disappointing finish for the bulls, as stocks surrendered early gains to close modestly lower yesterday. The Nasdaq Composite ($COMPQ) was trading 0.8% higher at its intraday peak, but reversed to finish 0.3% lower. The S&P 500 ($SPX) and Dow Jones Industrial Average ($DJI) followed similar patterns and settled lower by 0.4% and 0.5% respectively. Despite yesterday’s ugly overall price action, one bullish aspect of the session was that both small and mid-cap stocks exhibited relative strength to the broad market. The only one of the major indices to finish in positive territory, the S&P MidCap 400 Index ($MID) edged 0.2% higher. The small-cap Russell 2000 Index ($RUT) slipped just 0.1%. Breaking the recent pattern of solid price action into the final hour of trading, each of the main stock market indexes closed near its low of the day.
Total volume in the NYSE was 16% greater than the previous day’s level, while turnover in the Nasdaq increased 7%. Declining volume only fractionally exceeded advancing volume in both exchanges. However, in the first half of the trading session, the adv/dec volume ratios were firmly skewed to the bullish side. The higher volume decline across the board caused both the NYSE and Nasdaq Composite ($COMPQ) to register a bearish distribution day that was indicative of selling amongst banks, mutual funds, hedge funds, and other institutional traders.
In yesterday’s commentary, we said that, “The S&P 500, Dow Jones Industrial Average, and Nasdaq 100 indices have reached pivotal ‘make it or break it’ levels that may lead to a tug-of-war between bulls and bears and a bit of volatility in the coming days.” Indeed, a tug-of-war and increased volatility was exactly the theme of yesterday’s trading session. Given that the major indices were testing major pivotal resistance of their multi-year highs yesterday, we were not surprised to see a pullback. That’s why we also said yesterday that, “a moderate pullback or ‘shakeout’ in the interim (of stocks moving higher) would not be surprising.” Nevertheless, it was not good that the Nasdaq, S&P, and Dow each formed an ugly chart pattern known as a “bearish engulfing candlestick” on their daily charts yesterday. This occurs when the price of an index, ETF, or stock opens above the previous day’s high, but sells off to close below the prior day’s low. On the daily chart of PowerShares QQQ Trust ($QQQ) below, we have highlighted the pattern:
")
In addition to forming the bearish candlestick shown above, notice that $QQQ also “overcut” horizontal price resistance of its multi-year high. This is the opposite of an “”undercut,” which occurs when an ETF dips below an obvious level of price support, then quickly reverses back up. The “overcut” has the effect of triggering stops of traders who were anticipating buying the breakout to new highs.
As it appears the market may be poised for a healthy and welcome near-term correction, we are not targeting any additional ETFs on our watchlist for new trade entry today. Rather, we will monitor the performance of our existing open positions to see how well they hold up against any further retracement in the market. The iShares Mexico Index ($EWW) and Dow Jones Dividend Index ($DVY) both pulled back alongside of the broad market yesterday, but our position in iShares Nasdaq Composite Biotech ($IBB) showed solid relative strength by finishing flat. Simply comparing the percentage gain or loss of your positions on a day when the market moves down is a quick way to gauge the Relative Strength of your stock and ETF positions. The ProShares UltraShort Euro ($EUO), which has been on our ETF trading watchlist for the past several sessions, got blasted yesterday and losT major support of its primary uptrend line. However, there was no harm done because the $EUO trade setup never triggered with a valid entry price. In fact, $EUO was a good reminder of the danger of jumping the gun in trading.
Although yesterday’s distribution day and bearish engulfing pattern in the broad market may have been disappointing for the bulls, keep the correction in perspective. The market was overdue for at least a near-term pullback, and it is normal for an uptrending market to experience an occasional bout of heavier volume selling in even the steadiest of bull markets. Typically, a healthy market can sustain at least three distribution days within a one-month period before being overcome by the selling pressure. Further, it’s also positive that small and mid-cap growth stocks showed relative strength yesterday. As such, yesterday’s negative price action alone is no cause for alarm, but there is also no reason to take on additional exposure on the long side of the market until stocks prove they are able to bounce back and maintain resiliency.
stock commentary:
$BCOR broke out yesterday on heavy volume and closed near the top third of the day’s range, which is acceptable considering the market sold off during the afternoon. We missed the intitial entry point but the reward to risk ratio is still attractive even with a late buy at 16.10, so we are listing $BCOR as an official buy setup.
Note the big breakaway gap up on the daily chart below:
")
Our entry is just above yesterday’s close:
")
We raised the stop in EQIX to protect partial gains in case the price action dips below the two day low. We usually prefer to keep the original stop price until a stock is up at least two times what we risked, but we are playing it conservatively right now until there is more confirmation from the market. If EQIX does head lower we may be able to re-enter if there is a valid setup.
If you are a new subscriber, please e-mail [email protected] with any questions regarding our trading strategy, money management, or how to make the most out of this report.
relative strength combo watchlist:
Our Relative Strength Combo Watchlist makes it easy for subscribers to import data into their own scanning software, such as Tradestation, Interactive Brokers, and TC2000. This list is comprised of the strongest stocks (technically and fundamentally) in the market over the past six to 12 months. The scan is updated every Sunday, and this week’s RS Combo Watchlist can be downloaded by logging in to the Members Area of our web site.