Buy
– Signal generated on the close of April 30
We are now in confirmed buy mode, which means that we can go on margin if needed.
today’s watchlist (potential trade entries):

Having trouble seeing the open positions graphic above? Click here to view it directly on your web browser instead.
open positions:
Below is an overview of all open positions, as well as a report on all positions that were closed only since the previous day’s newsletter. Net P/L figures are based a $100,000 model portfolio. Changes to open positions since the previous report are listed in pink shaded cells below. Be sure to read the Wagner Daily subscriber guide for important, automatic rules on trade entries and exits.

Having trouble seeing the open positions graphic above? Click here to view it directly on your web browser instead.
closed positions:
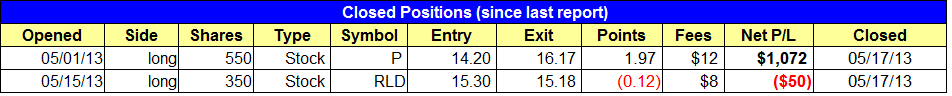
Having trouble seeing the closed positions graphic above? Click here to view it directly on your web browser instead.
ETF position notes:
- No trades were made.
stock position notes:
- Sold $P for a + $1,000 gain. Sold $RLD for a small loss (scratch).
ETF, stock, and broad market commentary:
Brushing off the previous afternoon’s bearish reversal, stocks raced back to once again finish the week at new highs. Both the Nasdaq Composite and S&P 500 cruised 1.0% higher, while the Dow Jones Industrial Average climbed 0.8%. As we’ve seen many times in recent weeks, all the main stock market indexes except the Nasdaq closed at fresh all-time highs. The Nasdaq sits at its highest level since the dot com bubble of late 2000.
Despite last Friday being monthly options expiration, which usually causes a volume spike in the market, turnover was surprisingly lighter than the previous day’s level. Total volume in the NYSE edged 1% lower, while trade in the Nasdaq receded 7%. Higher volume to accompany the solid gains would have been better. However, when stocks are already trading at new highs, and therefore devoid of overhead resistance levels, it requires only a minimum of buying interest in order for the market to move higher (which is why buying stocks breaking out of a base to new 52-week highs is a winning strategy).
The latest industry to demonstrate bullish sector rotation in this current rally is energy (oil and gas), which is showing the same signs of institutional money flow that semiconductors began exhibiting before the group took off last month.
Last week, several energy ETFs broke out above key levels of horizontal price resistance and are now set up for momentum swing trades. Of those ETFs that broke out, the one with the best long-term chart pattern is the S&P Select Energy SPDR ($XLE). On the long-term monthly chart below, notice that $XLE just broke out above resistance of its prior highs from 2011 (which is not readily apparent on the shorter-term daily chart interval):

As marked by the horizontal line, the breakout level was at the $81 area. Since $XLE closed at $80.77 last Thursday, the breakout only occurred in the most recent trading session of May 17 ($XLE gained 1.7% vs. S&P 500 rallying 1.0%). Since $XLE is only 1.3% above its monthly breakout level, it is not too far extended to enter near the current price level. As such, we will be buying $XLE at market on today’s open (no 5-minute rule applies). See today’s watchlist for additional trade details.
After recently closing out both Semiconductor HOLDR ($SMH) and DB Gold Double Short ($DZZ) for substantial gains, our current open ETF positions are US Natural Gas Fund ($UNG), Guggenheim China Real Estate ETF ($TAO), and iShares Indonesia ($EIDO). After today’s open, we will also be long $XLE (as per above).
$EIDO has not yet blasted off since our swing trade entry, but the ETF is still showing an unrealized gain and closed the week at a new all-time high. As shown on the weekly chart below, $EIDO has been forming a “base on base” pattern, so a rally above last week’s high could spark another wave higher within the current uptrend:

$TAO has been pulling back since its May 8 high, but the ETF found support at its 20-day exponential moving average and is now poised to resume its uptrend and rally to a new swing high. For anyone who happened to miss our initial buy entry into $TAO, an entry just above last Friday’s high of $23.07 provides a relatively low-risk secondary buy entry point because the ETF continues to act fine.
Although $UNG retraced a bit sharply off its highs earlier this month, last Friday’s 2.7% gain on higher volume was encouraging. If it gets above the May 17 high, $UNG will have broken out above convergence of its 20 and 50-day moving averages, which could enable the ETF to quickly move back to its prior highs. As such, we cannot give up on this trade yet and will continue to honor the original stop price for now.
$P hit our adjusted stop on the open last Friday and we are out with a + $1,072 gain on a 14% move. $RLD hit our tight stop and we are out with a very small loss.
We have a few new stock buy setups on today’s watchlist in $YELP, $NOW, $URI, and $SLCA. $YY is an IPO from 2012 that has recently broken its downtrend line on a nice pick up in volume. The weekly chart below shows the big volume move to new highs a few weeks ago. Since then the price action has formed a bullish short-term consolidation known as 3-weeks tight. This occurs when three closes in a row on the weekly chart are at or near the same price, which is a sign of accumulation.

On the daily chart, the 10-day MA caught up to the price action last week. A move above the high of Friday’s inside day could spark some buying interest and potentially send $YELP to new highs very quickly.

Thoughts on remaining buy setups:
$NOW – Has pulled back to the 20-day EMA after a big volume gap up from earnings in late April. We are looking for the uptrend to resume shortly after our entry.
$URI – Adding to an existing position with the idea that the price action will not dip below the low of the 5/14 reversal candle. The higher stop applies to the share we add only.
$SCA – Looking to establish a starter position on a slight pullback to the $22 area. We will add to the position if the price and volume action continues to improve.