Current signal generated on close of November 13.
Portfolio exposure can be anywhere from 75 to 100% long. If positions are holding up well, then one can add exposure beyond 100% (for experienced traders only).
Past signals:
- Neutral signal generated on close of November 6.
- Buy signal generated on close of September 9
- Neutral signal generated on close of August 15
- Buy signal generated on close of July 11
- Neutral signal generated on close of July 5
- Sell signal generated on close of June 24
today’s watchlist (potential trade entries):

Having trouble seeing the open positions graphic above? Click here to view it directly on your web browser instead.
Below is an overview of all open positions, as well as a report on all positions that were closed only since the previous day’s newsletter. Changes to open positions since the previous report are listed in pink shaded cells below. Be sure to read the Wagner Daily subscriber guide for important, automatic rules on trade entries and exits.

Having trouble seeing the open positions graphic above? Click here to view it directly on your web browser instead.
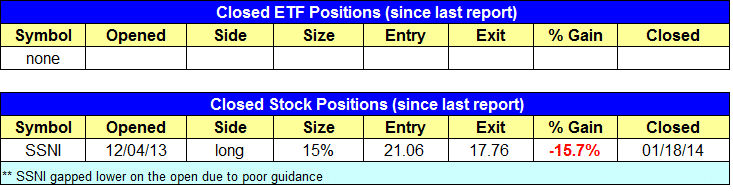
closed positions:
Having trouble seeing the closed positions graphic above? Click here to view it directly on your web browser instead.
ETF position notes:
- Note that only one setup can trigger in $GREK. If you are unable to set this type of order up with your current broker, then just go with the buy stop to play it safe.
- The 5-minute rule does not apply to buy limit orders, just buy stops.
stock position notes:
- Sold $SSNI on the ugly gap down.
ETF, stock, and broad market commentary:
Stocks sold off on Friday for the most part with only the Dow Jones closing in positive territory. Since volume was heavier on the NYSE and NASDAQ, both the S&P 500 and NASDAQ Composite logged another distribution day. The current rally remains in good shape. However, conditions could turn sour if distribution days begin to cluster.
Every trader has his/her own approach to scanning charts and locating buy setups. That being said, there is one technique that every trader should use no matter the trading style and that is multiple time frame analysis (let’s call it MTF for short).
MTF analysis is not a new concept. It is very simple to use, but quite powerful. However, we find that many swing to intermediate-term traders hyper-focus on the daily chart.
The daily chart is pivotal for locating low-risk buy setups, but if we were to simply focus on the daily time frame then we would be ignoring the power of confirmation from higher time frames, such as the weekly and monthly chart.
Let’s run through a quick example of MTF analysis in SPDR S&P Oil & Gas Exploration & Production ETF ($XOP).
Starting with a monthly chart with at least 10 years of data or more (if possible), we see that $XOP stalled at all-time highs a few months ago. Those who were buying $XOP based on a daily chart with three to five years of data may not have even seen the highs from 2008.
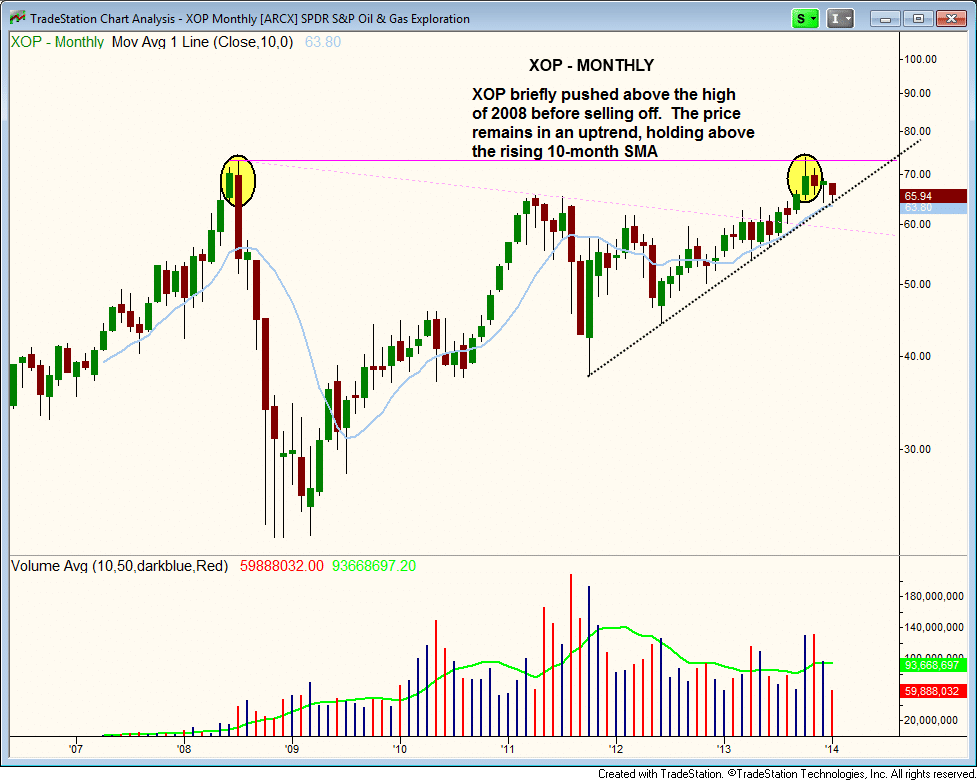
Although $XOP stalled at the 2008 high, it remains in an uptrend, holding above the rising 10-month MA, while the current base is holding above the prior highs of 2011.
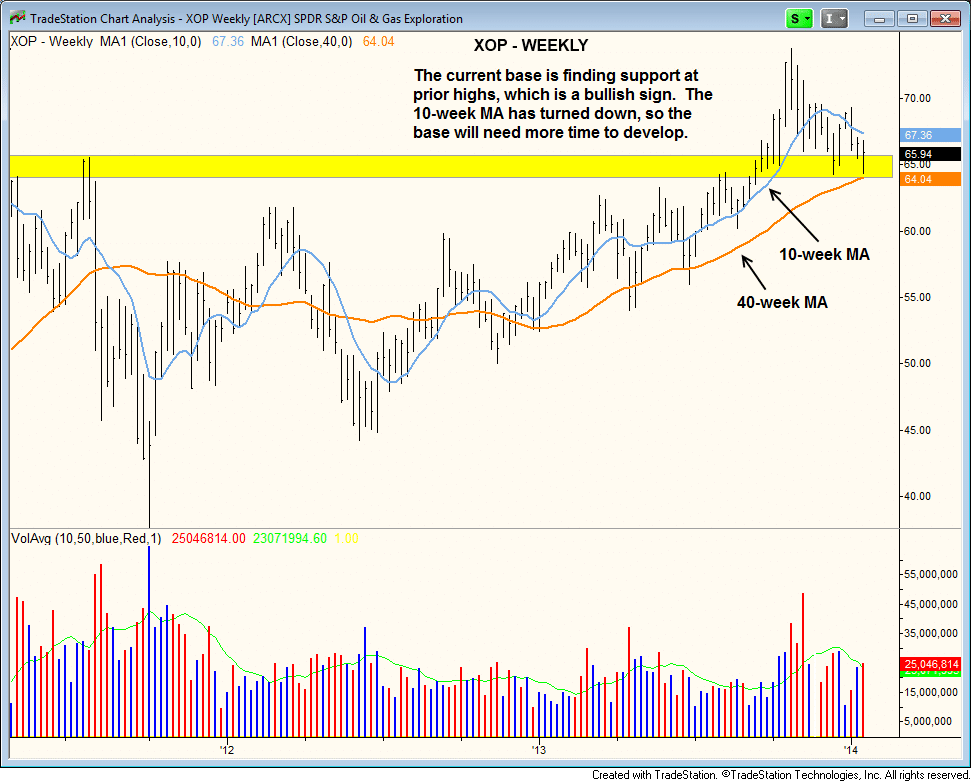
On the weekly chart, the 10-week MA is trending lower, but the price is still above the 40-week MA. The current base will take some time to develop, but as continues to chop around the 10-week MA should eventually flatten out and begin to tick higher.
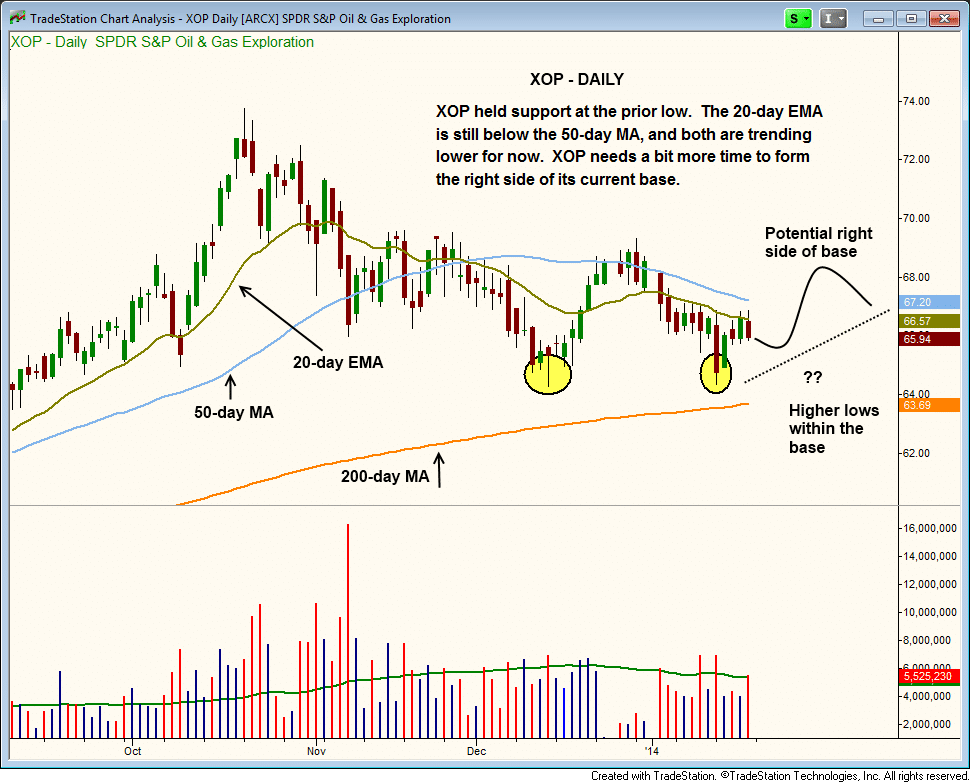
The $XOP daily chart shows last week’s price action holding above the prior swing low. If this low holds, then the price action can begin to set higher swing lows with the base and form the right side of the pattern.
The next breakout in $XOP would be the one that launches it to new highs on multiple time frames, which could be a very powerful buy signal.
On the stock side we stopped out of $SSNI due to an ugly gap down from poor guidance. There is no need to try and stay in and hope for a comeback, as it is usually best to get out and rotate the money into a setup that could be moving right now (especially when market is in trend mode).
We have one new buy setup today in $AL, which is an add to an existing core position.
$AL held above the 10-week MA last week which is a great sign.
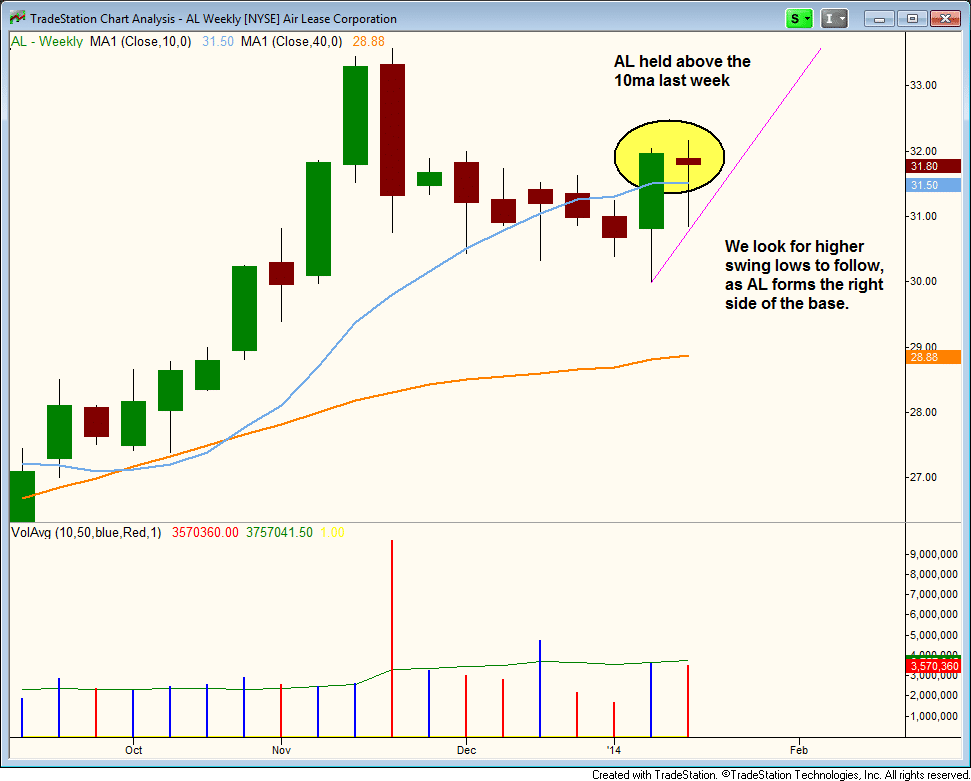
We are looking for a buy entry over the Friday afternoon high, with a stop beneath last week’s low. Either the price action moves out from here, or the pattern may need more time to develop.