Current signal generated on close of June 24
Past signals:
- Neutral signal on the close of June 20
- Buy signal on the close of June 13
- Neutral signal on close of June 12
- Buy signal on the close of April 30
today’s watchlist (potential trade entries):

Having trouble seeing the open positions graphic above? Click here to view it directly on your web browser instead.
open positions:
Below is an overview of all open positions, as well as a report on all positions that were closed only since the previous day’s newsletter. Net P/L figures are based a $100,000 model portfolio. Changes to open positions since the previous report are listed in pink shaded cells below. Be sure to read the Wagner Daily subscriber guide for important, automatic rules on trade entries and exits.

Having trouble seeing the open positions graphic above? Click here to view it directly on your web browser instead.
closed positions:

Having trouble seeing the closed positions graphic above? Click here to view it directly on your web browser instead.
ETF position notes:
- $TAN pullback entry is back in play.
stock position notes:
- No trades were made.
ETF, stock, and broad market commentary:
Stocks continued bouncing off their June 24 lows yesterday, as the broad market scored another round of gains. The major indices advanced around 0.7% each, on volume that was mixed. Although turnover in the NYSE was 5% lighter than the previous day’s level, total volume in the NASDAQ ticked 4% higher. This enabled the NASDAQ to register a bullish “accumulation day” that was indicative of institutional buying.
Although stocks managed their third straight round of gains yesterday, it is risky and probably a bit too early to establish new long positions right now. This is because several of the major indices are now running into new overhead resistance of their 20 and 50-day moving averages (remember that a prior level of support technically becomes the new level of resistance after the support is broken). One such example can be seen in the ETF proxy for the benchmark S&P 500 Index ($SPY):

Notice that yesterday’s (June 27) intraday high in $SPY perfectly coincided with near-term resistance of the 20-day exponential moving average (beige line). After testing that resistance level, $SPY subsequently closed at its intraday low. Furthermore, the 20-day EMA has recently crossed below the 50-day MA (teal line), which can be a signal that an intermediate-term uptrend may be reversing.
Because of the overhead supply and technical resistance levels currently confronting stocks, the market may be subject to a pullback over the next few days. At the least, it would be reasonable to expect stocks to chop around and consolidate a bit before moving higher.
In many cases, the first bounce into resistance that follows a sharp selloff (like we saw last week) provides low-risk entry points for new short positions, in anticipation of another leg down in the market. However, this time we are NOT convinced that selling short right now is the right thing to do. Why? Simply because leading stocks have been holding up pretty well throughout the market correction.
When leading stocks are not breaking down en masse, stock market corrections are typically short-lived. Paying attention only to the price action of the main stock market indexes, while ignoring the price action of leading stocks, is a big mistake that new traders frequently make. They fail to realize that the major indices usually lag behind leading stocks, and not the other way around (major indices setting the pace of leading stocks).
So, if it’s too early to start buying stocks right now, but conditions are also not ideal for initiating new short positions, what is the best plan of action right now? Having a bit of patience and sitting mostly or fully in cash for at least the next few days is probably the best bet. Dipping a toe in the water through buying one or two positions showing relative strength AND with reduced share size would not be too risky; however, this is definitely NOT the time to be aggressive on the long side.
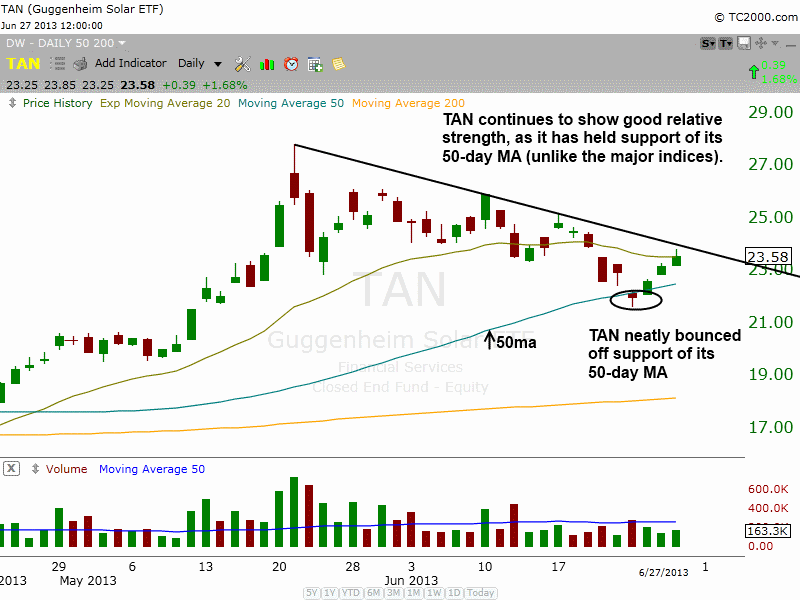
As far as ETFs go, we are stalking Guggenheim Solar Index ETF ($TAN) for potential buy entry in the coming days. Unlike the main stock market indexes, all of which recently fell down below their 20 and 50-day moving averages, $TAN merely tested support of its 50-day moving average, than perfectly bounced off it the following day:

Before the stock market correction began, $TAN was one of the strongest ETFs in the market, and the ETF still continues to show great relative strength. As such, we are indeed comfortable with stalking $TAN for potential buy entry with reduced share size, but only if it breaks out above its downtrend line from the May 2013 high. Please note our trade details for this swing trade setup in today’s watchlist.
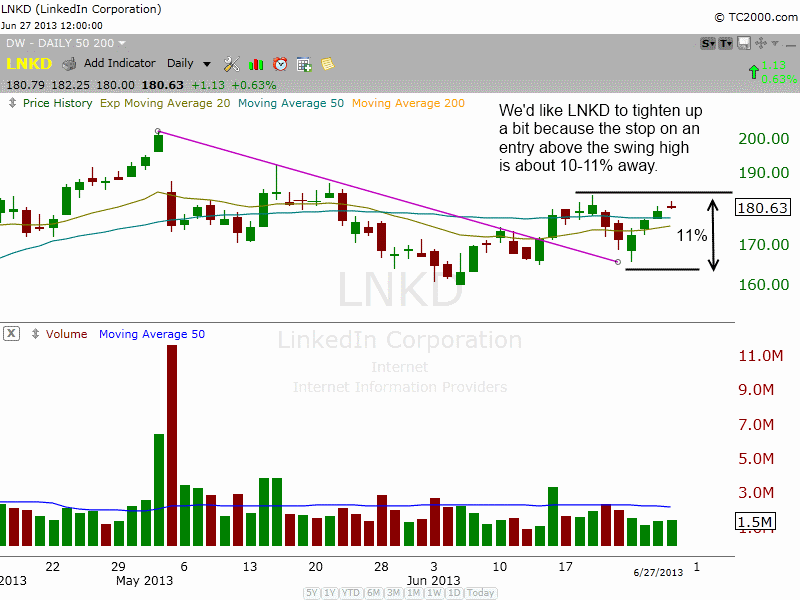
On the stock side, our internal watchlist continues to grow, as the leading stock portion of the timing model is in good shape. $LNKD remains one of the top setups on our watchlist, but we would like to see a little more tightening of the price action next week to produce a low risk entry point.

If we were to buy a breakout above the current swing high, then our stop would have to be about 11% away, which is just a bit too wide for such a liquid stock. Whether $LNKD has to put in a false breakout, or simply pull back in few a few days, we feel that the setup just needs a bit more time. But overall, $LNKD is in good shape after breaking the downtrend line of the consolidation and setting two higher swing lows within the base (if the current low holds).