Current signal generated on close of June 24
Past signals:
- Neutral signal on the close of June 20
- Buy signal on the close of June 13
- Neutral signal on close of June 12
- Buy signal on the close of April 30
today’s watchlist (potential trade entries):

Having trouble seeing the open positions graphic above? Click here to view it directly on your web browser instead.
open positions:
Below is an overview of all open positions, as well as a report on all positions that were closed only since the previous day’s newsletter. Net P/L figures are based a $100,000 model portfolio. Changes to open positions since the previous report are listed in pink shaded cells below. Be sure to read the Wagner Daily subscriber guide for important, automatic rules on trade entries and exits.

Having trouble seeing the open positions graphic above? Click here to view it directly on your web browser instead.
closed positions:

Having trouble seeing the closed positions graphic above? Click here to view it directly on your web browser instead.
ETF position notes:
- Canceling $TAN buy limit order for now. Will continue to monitor for pullback entry.
stock position notes:
- No trades were made.
ETF, stock, and broad market commentary:
Stocks rallied for the second straight day on lighter volume, with most averages closing up near 1.0% on the session. The small-cap Russell 2000 was a noticeable laggard, gaining only 0.3%; however, is was the first index to test the 50-day MA, which produced the stalling action.
Although our timing model is in sell mode, the majority of leading stocks we follow have held up well. Rather than short the market on this bounce, we feel that is is best to lay low and wait for some accumulation days in the market as a sign to add long exposure.
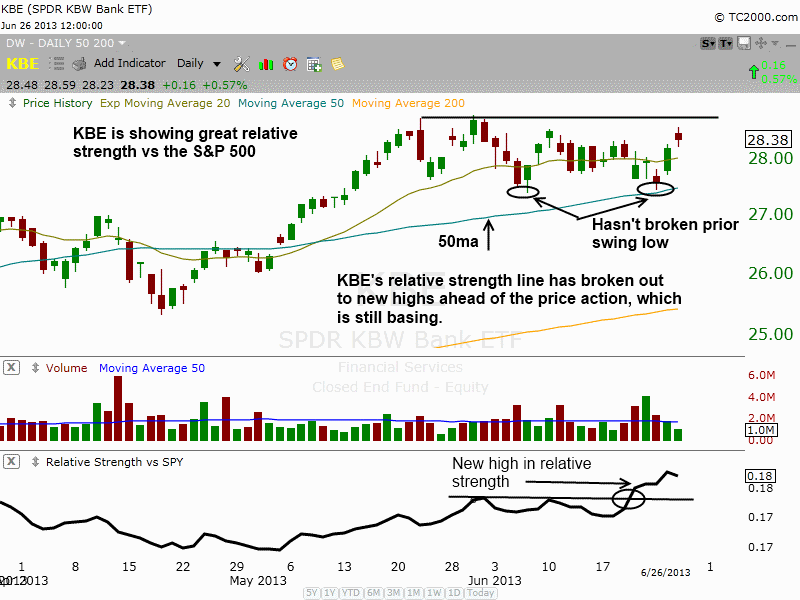
SPDR KBW Bank ETF ($KBE) continues to show great relative strength against the S&P 500 and is still holding above the 50-day MA. While we do not expect $KBE to break out when the market is struggling to find a bottom, we do see the strength as a positive sign. Along with the Broker-Dealer ETF ($IAI), the financials are doing their part to keep the S&P 500 in an uptrend.
Note the relative strength line on the daily chart of $KBE below. The black line at the bottom of the chart measures the daily strength of $KBE vs $SPY. When the line is going up, $KBE is outperforming $SPY (when the line is going down, $SPY is outperforming $KBE). Notice how the relative strength line has broken out to new highs ahead of the price action, which is still trading in a tight range. This is bullish divergence, which suggests that if/when market conditions improve, then $KBE could be one of the first ETFs to breakout ahead of the market.

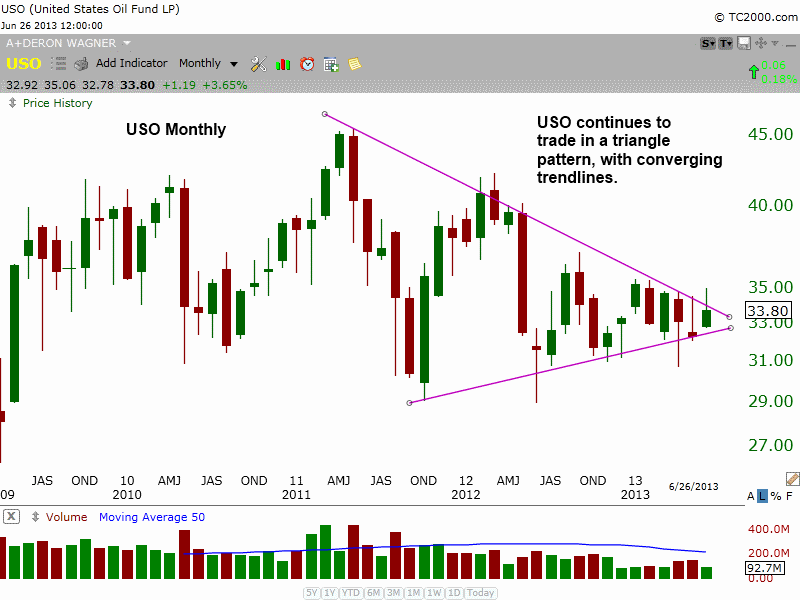
A few weeks ago, we mentioned the symmetrical triangle pattern that was near completion in United States Oil Fund LP ($USO). We attemtped to buy the breakout of the downtrend line, but our entry never triggered, as $USO reversed lower (false breakout).

Ideally, we would like to see $USO tighten up over the next week or two so that we can grab a lower risk entry point with partial size, and add the rest on the break of the downtrend line. $USO has been trading in between $30 and $40 since 2009, so this pattern may simply go nowhere and just lead to further chop. Also, the pattern is running out of real estate and does not have much more time to develop (the price action is almost up to the point of the triangle).
$TAN gapped higher and did not trigger our buy limit order. We are canceling the order for now, but will look for an entry point if/when $TAN pulls back within the next few days. With some patience, we may be able to grab a low risk entry off the 50-day MA from a bullish reversal candle (if one develops).
On the stock side we remain long $AWAY, which basically chopped around all day after a strong advance on Tuesday. If we get lucky and $AWAY breaks out to new highs while the market is still weak, then we will sell into strength and look to re-enter.
Reading charts is more than just looking at price patterns. Volume plays a big role in our analysis and it should in yours too. Analyzing the volume pattern within a base is something we have always done. Like anything else, the more you study volume patterns, the better you will become at identifying clear cut signs of accumulation or distribution. Please note that counting accumulation vs distribution will add to your bottom line, but like everything in trading, just because there is great accumulation does not mean the stock will not go down.Oil ready to breakout from triangle pattern ($USO)
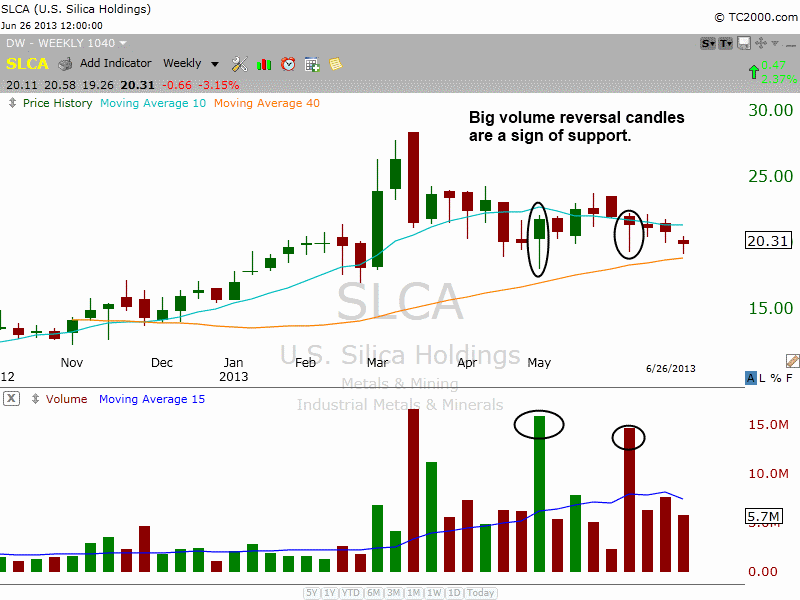
The chart of $SLCA below is a good example of a stock that is under accumulation, but the accumulation is not so obvious because there are no big volume spikes on big green candles. When analyzing volume, we focus on the lows of the base, starting from the middle of the base and working our way to the right. The two volume spikes within the base are on bullish reversal candles (do not count the first spike at the highs, as that action begins the correction). On both days, buyers stepped in to $SLCA with big volume and rallied the price off the lows of the base to close near the highs of the week. This is stealth accumulation.
