market timing model:
Sell – Signal generated on the close of October 12 (click here for more details)
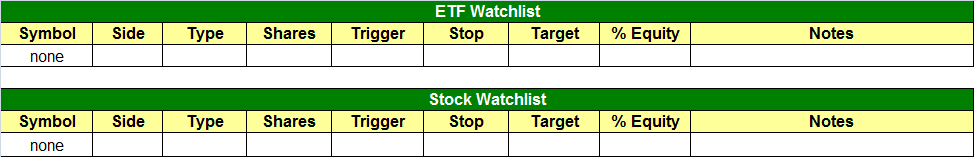
today’s watchlist (potential trade entries):
Having trouble seeing the open positions graphic above? Click here to view it directly on your web browser instead.
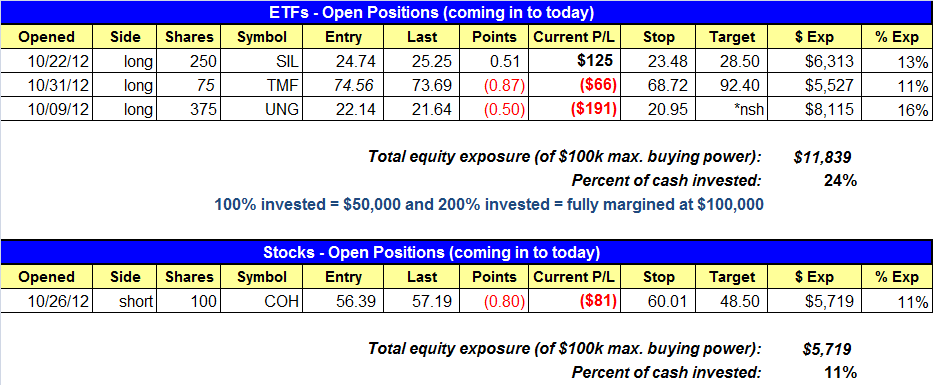
open positions:
Below is an overview of all open positions, as well as a report on all positions that were closed only since the previous day’s newsletter. Net P/L figures are based on two separate $50,000 model portfolios (one for ETFs and one for stocks). Changes to open positions since the previous report are listed in pink shaded cells below. Be sure to read the Wagner Daily subscriber guide for important, automatic rules on trade entries and exits.
Having trouble seeing the open positions graphic above? Click here to view it directly on your web browser instead.
closed positions:

Having trouble seeing the closed positions graphic above? Click here to view it directly on your web browser instead.
ETF position notes:
- No trades were made.
stock position notes:
- No trades were made.
ETF and broad market commentary:
After oscillating in a choppy, lethargic range for five straight days, the major indices made a substantial move yesterday, as each index climbed at least one percent. Stocks gapped higher on the open, rallied throughout the morning, then consolidated near their intraday highs throughout the rest of the session. The Nasdaq Composite ($COMPX) jumped 1.4%, the S&P 500 Index ($SPX) 1.1%, and the Dow Jones Industrial Average ($DJIA) 1.0%. Showing quite a bit of relative strength, the S&P Midcap 400 Index ($MID) zoomed 2.4% higher, but the small-cap Russell 2000 curiously increased only 1.1%. It is unusual for there to be such a large price divergence between the small and mid-cap indexes.
Unfortunately for the bulls, yesterday’s rally lacked the convincing punch of institutional trading activity. Total volume in the Nasdaq managed to increase 3%, but turnover in the NYSE was 3% lighter than the previous day’s level. Nevertheless, trade remained above 50-day average levels in both the Nasdaq and NYSE. In both exchanges, advancing volume exceeded declining volume by a ratio of approximately 4 to 1. This obviously indicated positive breadth in the market, but the ADV/DEC volume ratio was not extreme.
On the surface, yesterday’s large percentage gains of the main stock market indexes may seem encouraging, or even impressive, to the casual observer. However, it is important to keep yesterday’s bounce in perspective with the degree of the overall decline in the latter half of September and throughout the month of October. For example, PowerShares QQQ Trust ($QQQ), a popular ETF proxy for the Nasdaq 100 Index, fell 7.8% from its September high down to its October low (based on closing prices). Therefore, yesterday’s 1.7% rally in QQQ means the Nasdaq 100 is still sitting within the bottom 25% of its peak to trough range over the past six weeks. Put another way,yesterday’s stock market advance was technically nothing more than an overdue bounce off the lows. This, of course, does not mean yesterday’s rally could not go on to be the start of an eventual upside trend reversal, but one mere day of price action, no matter how bullish or bearish, does not make a new trend.
Overall, our near-term plan remains the same as we’ve mentioned several times over the past week, which is to view any significant market bounce as an opportunity to initiate new short positions on the weakest ETFs as they approach new overhead resistance levels. One of the ETFs we are monitoring for an ideal short sale entry point is indeed QQQ. On the annotated daily chart of QQQ below, notice that yesterday’s rally followed an “undercut” of major support of its 200–day moving average, which provided the perfect technical excuse for a bounce. Our ideal zone for selling short QQQ on a bounce (or buying an inversely correlated “short ETF”) is labeled on the following chart:

Another ETF we have recently mentioned as a potential short sale candidate on a bounce is iShares Nasdaq Biotechnology ($IBB). A former ETF market leader throughout most of 2012, IBB has reversed sharply and is now showing major relative weakness to the broad market. On the chart below, notice that IBB continued selling off to new lows throughout the last three days of October, even though the Nasdaq was only trading in a sideways range during the same period. It finally bounced yesterday, but we would ideally like to see IBB rally substantially higher before selling short (or buying the associated inverse ETF) because this would provide us with a more positive reward to risk ratio on the trade:

Although the charts of QQQ and IBB show the most ideal price levels for selling short, there is obviously no way of knowing if the market will cooperate with us. Given the kind of weakness that we’ve seen lately, including continued relative weakness in key large-cap tech stocks like Apple ($AAPL), it would not be surprising if there is minimal upside follow-through on yesterday’s bounce. But even if there are further gains to be had in the coming days, and these ETFs manage to bounce into our target area for selling short, we still will not blindly initiate new short positions the instant these ETFs first touch resistance. Rather, we then need to wait for the proper signal to sell short, such as a bearish reversal candle or a significant opening gap down that follows any bounce into resistance. In case you missed it, be sure to check out this educational 3-minute video we posted on our trading blog yesterday, as it explains the importance of having patience for proper entry points when selling short.
stock commentary:
$CMI is a good example of how patient one needs to be on the short side. The combination of no low risk entry point and the market potentially running higher made it easy for us to lay off $CMI. We always wait for some sort of stalling action over 1 to 3 candles as a signal to sell short. With no signal in place there wasn’t much to do with $CMI other than to wait.

$SBUX is one of of the former leaders we are monitoring for a short entry. $SBUX rallied over 500% during a 37 month run up that stalled last April. Since then $SBUX has broken down below the 50 and 200-day MAs, and is currently forming a two month base at the lows, still trading below all the major averages. We are looking for a probe above the 20-day EMA followed by some stalling action.

Although it may seem tempting to operate on the long side of the market for the next few days, the market simply can not be trusted. We expect the current bounce to be short lived and eventually lead to further selling……..UNLESS there is a buy signal with some follow through to the upside.
If you are a new subscriber, please e-mail [email protected] with any questions regarding our trading strategy, money management, or how to make the most out of this report.
relative strength combo watchlist:
Our Relative Strength Combo Watchlist makes it easy for subscribers to import data into their own scanning software, such as Tradestation, Interactive Brokers, and TC2000. This list is comprised of the strongest stocks (technically and fundamentally) in the market over the past six to 12 months. The scan is updated every Sunday, and this week’s RS Combo Watchlist can be downloaded by logging in to the Members Area of our web site.