market timing model:
Buy – Signal generated on the close of November 23 (click here for more details)
today’s watchlist (potential trade entries):

Having trouble seeing the open positions graphic above? Click here to view it directly on your web browser instead.
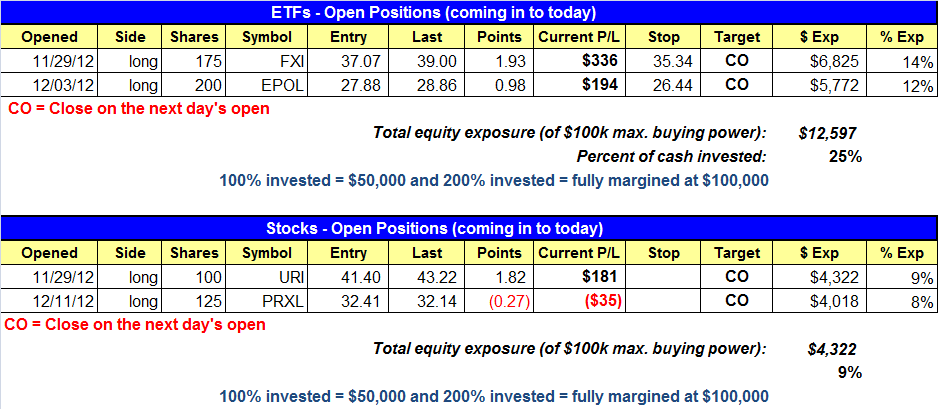
open positions:
Below is an overview of all open positions, as well as a report on all positions that were closed only since the previous day’s newsletter. Net P/L figures are based on two separate $50,000 model portfolios (one for ETFs and one for stocks). Changes to open positions since the previous report are listed in pink shaded cells below. Be sure to read the Wagner Daily subscriber guide for important, automatic rules on trade entries and exits.
Having trouble seeing the open positions graphic above?Click here to view it directly on your web browser instead.
closed positions:

Having trouble seeing the closed positions graphic above? Click here to view it directly on your web browser instead.
ETF position notes:
- $IBB buy stop triggered and we are out.
stock position notes:
- $VMC buy setup is canceled.
ETF and broad market commentary:
For the second day in a row the S&P 500 failed to hold on to morning gains and sold off in the final 90 minutes of trading. After climbing as much as 0.7% intraday, the S&P 500 gave back all gains and just barely closed in positive territory at 0.4%. The Dow Jones Industrial Average was close behind at -0.02%. The S&P Midcap 400 and Nasdaq Composite closed down -0.2% and -0.3% respectively. The small-cap Russell 2000 was a noticeable laggard with a 0.7% loss. Total volume increased on the NYSE by 5% but was lighter by 6% on the Nasdaq. Although the S&P 500 closed positive on the day, the higher volume stalling action is churning, which counts as a bearish distribution day.
Back in August, the Wisdomtree India Fund ($EPI) broke a near two year downtrend line after holding support at 16.00 through the summer. After a quick thrust above the downtrend line, $EPI pulled back about 12% off the swing high to support of the prior breakout level at 18.00 and the backside of the downtrend line on the weekly chart below.

After successfully testing support at 18.00, $EPI broke above the short-term downtrend line and the 50-day MA on November 29. The strong thrust off the lows of the base is a bullish sign and we look for $EPI to digest the recent move with a week or two of sideways action. As with all valid trend reversals, the 50-day MA crossed above the 200-day MA and 50-day MA itself is in a clear uptrend. We look for the price action during any consolidation to at the very least hold above the 50-day MA. An ugly break of the 50-day MA would signal that the base needs several more weeks of consolidation before it is ready to push higher IF it recovers. The setup is not actionable right now but we are monitoring the action for an entry point, provided that market conditions do not continue to deteriorate.

SPDR S&P Metals and Mining ETF ($XME) peaked along with the market on September 14 with a quick probe above the 200-day MA and sharp selloff. After two more stalled attempts to rally above the 200-day MA in October with each resulting in a lower highs, $XME is once again at resistance of the 200-day MA. Wednesday’s bearish reversal candle could lead to a fourth failed attempt to push through the 200-day MA. $XME may offer a short entry within the next few days below the 200-day MA, but for now there is no action.

Given the lack of explosive price action in leadership stocks and the late day selling in the averages the past two days, the market could be vulnerable to a sell off in the short term. Although the market has pushed higher the past few weeks, we have not seen much of an improvement in leadership stocks and that remains a big concern. Without strong leadership it will be very difficult for the market to stage a meaningful advance. Because of this, we are making a judgment call to sell open long positions at market on Thursday’s open to lock in gains. We are not calling the current rally dead, but we do not mind stepping aside for a few days and monitoring the price action.
stock commentary:
We are selling $URI and $PRXL at market due to Wednesday’s stalling actinon in the S&P 500. We are also cancelling the $VMC buy setup, as we see no reason to add more exposure when the exposure we already have isn’t doing much of anything.
Our scans have produced some decent buy candidates the past few weeks, but most of these stocks are not the A rated market stocks that lead a market higher. A rated stocks are liquid stocks with top relative strength rankings and strong fundamentals (think AAPL BIDU LNKD KORS). $CRM was an A rated stock that broke out a few days ago, but where are the others?
The short-term plan is to sit in cash as we wait for the next move. If we see further selling we may add some short exposure provided there are quality patterns to short. Overall, we do not want to do too much as total volume begins to dry up in mid to late December.
If you are a new subscriber, please e-mail [email protected] with any questions regarding our trading strategy, money management, or how to make the most out of this report.
relative strength combo watchlist:
Our Relative Strength Combo Watchlist makes it easy for subscribers to import data into their own scanning software, such as Tradestation, Interactive Brokers, and TC2000. This list is comprised of the strongest stocks (technically and fundamentally) in the market over the past six to 12 months. The scan is updated every Sunday, and this week’s RS Combo Watchlist can be downloaded by logging in to the Members Area of our web site.