Current signal generated on close of Feb. 13.
Portfolio exposure can be anywhere from 50% to 100% long (or more), depending on how open positions have held up.
Past signals:
- Sell signal generated on close of February 3.
- Neutral signal generated on close of January 24.
- Buy signal generated on close of November 13
- Buy signal generated on close of September 9
- Neutral signal generated on close of August 15
- Buy signal generated on close of July 11
- Neutral signal generated on close of July 5
- Sell signal generated on close of June 24
today’s watchlist (potential trade entries):

Having trouble seeing the open positions graphic above? Click here to view it directly on your web browser instead.
Below is an overview of all open positions, as well as a report on all positions that were closed only since the previous day’s newsletter. Changes to open positions since the previous report are listed in pink shaded cells below. Be sure to read the Wagner Daily subscriber guide for important, automatic rules on trade entries and exits.

Having trouble seeing the open positions graphic above? Click here to view it directly on your web browser instead.
closed positions:
Having trouble seeing the closed positions graphic above? Click here to view it directly on your web browser instead.
ETF position notes:
- $EDZ buy limit order triggered to add to existing position.
stock position notes:
- Note that only one buy setup in $IRBT will trigger, the other is to be canceled. Most brokers should allow you to place two orders at once. If you do not have the ability to do so and you’re serious about your trading, then we recommend moving to a brokerage for active traders such as Interactive Brokers or Tradestation.
ETF, stock, and broad market commentary:
Wednesday’s trading produced much of the same sideways chop that we have seen all week, with the averages showing strength early, but failing to hold on to gains in the afternoon. Small and mid-cap stocks outperformed, with gains of +0.7% and +0.5% respectively, while the Nasdaq Composite and S&P 500 basically closed flat.
After an explosive rally off the recent lows, the major averages have struggled to push higher the past week and a half. However, leadership stocks remain in good shape.
Leading solar stock SolarCity ($SCTY) broke out to new highs this week, helping out our current long position in solar ETF ($TAN), which is up about 10% from our entry on Feb. 14. We are also long $SCTY in our stock portfolio from an entry on Dec. 19, which is now up 59%.
After breaking above the 40-week MA on huge volume, Junior Gold Miners ETF ($GDXJ) is in the process of pulling back on lighter volume the past two weeks. We are patiently waiting for a pullback entry around $40, where there is support from the 40-week MA and the blue uptrend line. The 10-week MA is catching up quickly and could also provide support depending on how the action unfolds.
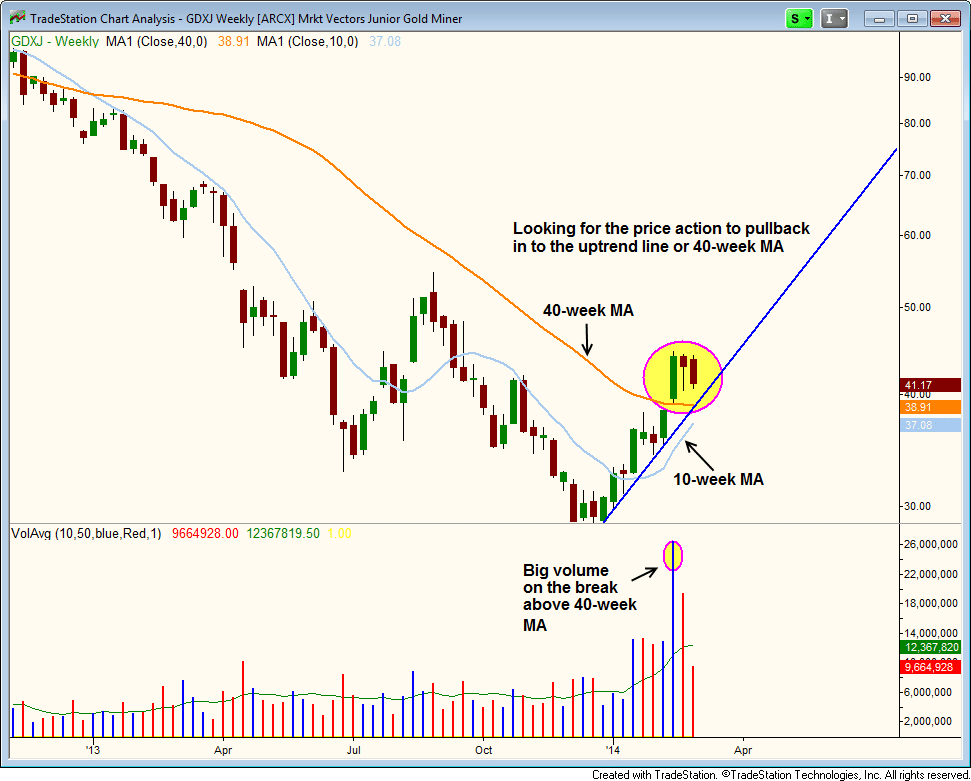
Ideally, we’d like to see an undercut of the 40-week MA to produce a shakeout candle, but that is not a requirement to make the setup actionable.
Continuing with the commodity theme, $UNG is also in pullback mode this week after stalling out once again at $27. There is support from the highs of the last base around $24, as well as the rising 10-week MA, which is currently at 23.31 and climbing.
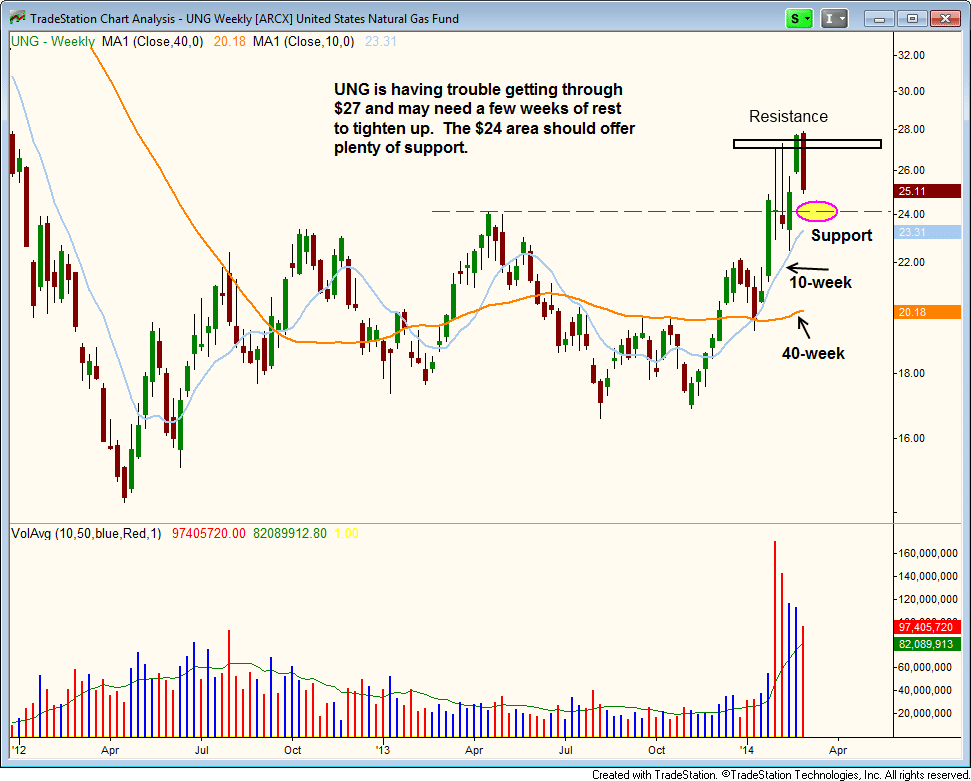
The 10-week MA is well above the 40-week MA, and the 40-week MA is just beginning to turn up, so $UNG is starting to show signs of bullish momentum.
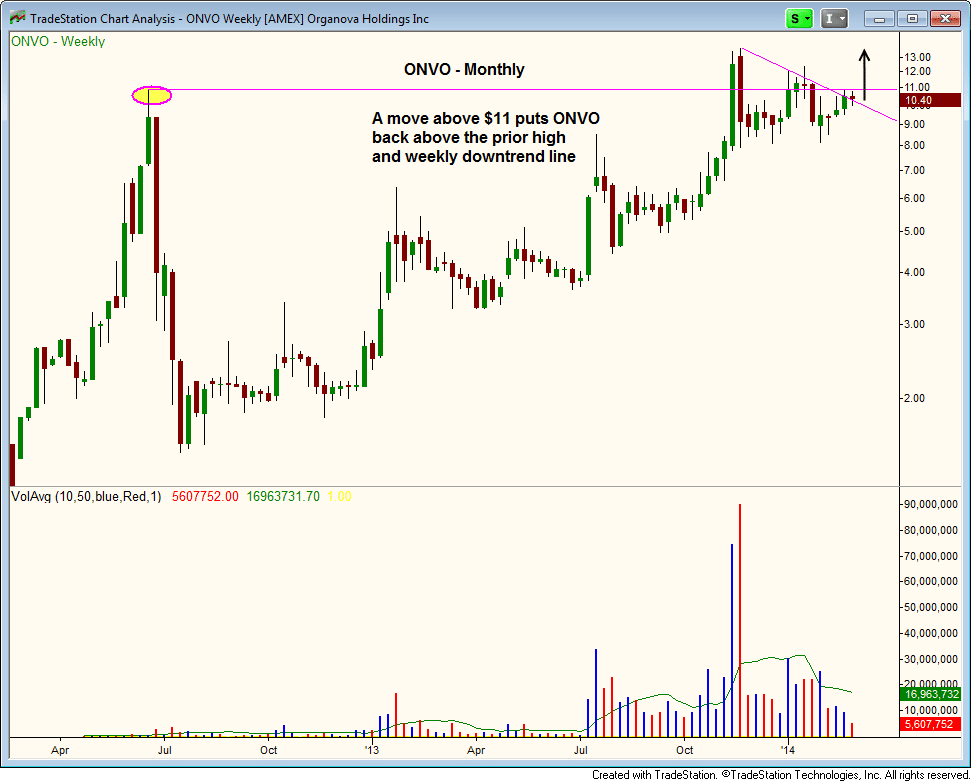
On the stock side, we have one new setup in $ONVO, along with a new buy scenario in $IRBT. The plan is to buy $IRBT on strength with a buy stop, or on weakness with a buy limit. Whichever setup triggers first is the one we take. The other setup is to be canceled.
Looking at the daily chart of $ONVO, the price action is trading just above the downtrend line and all moving averages.
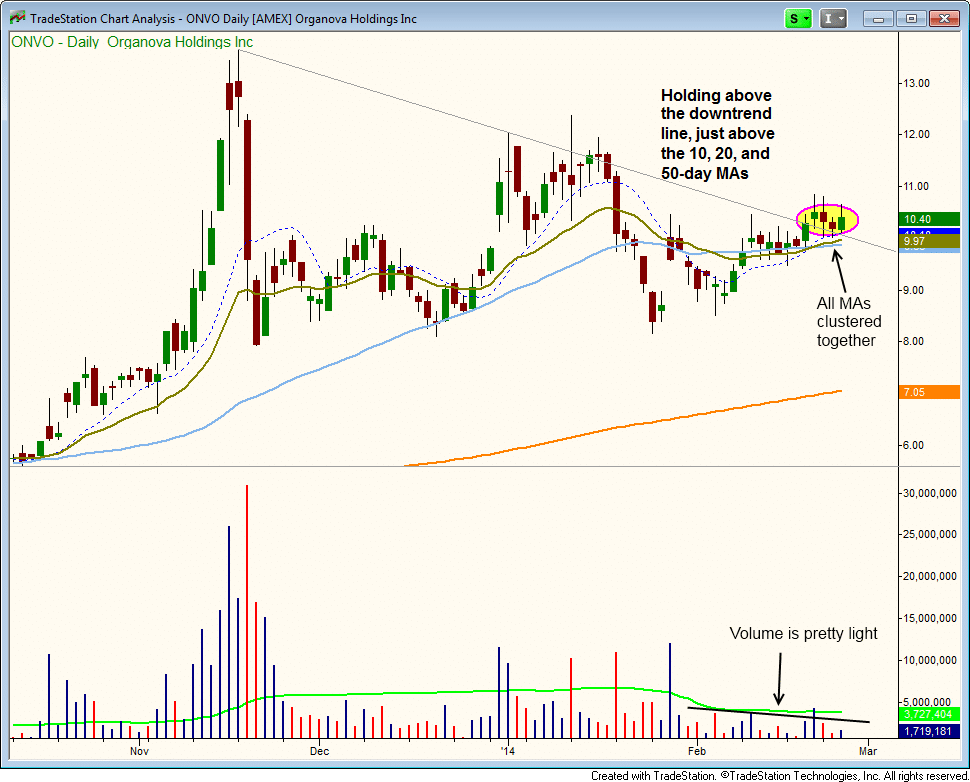
Although $ONVO had a rough go of it in November of last year, it has had plenty of time to work off that ugly selling as evidenced by the dry up in volume. The 50-day average volume was around 6 million shares per day and now is just under 4 million.
$ONVO is a potential breakout on multiple time frames, as a move above the current base high would also lead to a breakout to new all-time highs.
We raised the stop in $VNDA to just below break-even in case the current move out fails to hold above the 10-day MA. We also raised the stop in $WBAI, looking for the $40 level to hold.