Sell
– Signal generated on the close of April 18 (click here for more details)
today’s watchlist (potential trade entries):
 Having trouble seeing the open positions graphic above? Click here to view it directly on your web browser instead.
open positions:
Below is an overview of all open positions, as well as a report on all positions that were closed only since the previous day’s newsletter. Net P/L figures are based a $100,000 model portfolio. Changes to open positions since the previous report are listed in pink shaded cells below. Be sure to read the Wagner Daily subscriber guide for important, automatic rules on trade entries and exits.
 Having trouble seeing the open positions graphic above? Click here to view it directly on your web browser instead.
closed positions:

Having trouble seeing the closed positions graphic above? Click here to view it directly on your web browser instead.
ETF position notes:
- No trades were made.
stock position notes:
- No trades were made.
ETF, stock, and broad market commentary:
Stocks registered their worst weekly losses of the year last week, but on a positive note last Friday. Bouncing off support of its 50-day moving average, the S&P 500 rose 0.9%. The Dow Jones Industrial Average lagged behind by only edging 0.1% higher. However, it was positive that the NASDAQ Composite jumped 1.3% on the day.
Unfortunately, last Friday’s stock market gains were not accompanied by higher volume. Turnover in both exchanges was slightly lower than the previous day’s levels, indicating a lack of conviction among banks, mutual funds, hedge funds, and other institutions. Higher volume would have been better for the bulls.
Although our market timing model currently in “sell” mode, the great thing about ETFs in market conditions such as the present is the many different types of ETFs that allow traders to avoid having a high correlation to the direction of the US markets.
Presently, most of the best looking ETFs are international ETFs. More specifically, they are Asian ETFs. Going into today, iShares Indonesia ETF ($EIDO) remains on our watchlist as a potential buy entry. While the S&P 500 shed more than 2% last week, $EIDO actually gained just over 2%.
This bullish weekly divergence in $EIDO of more than 4%, compared to the S&P 500, indicates high relative strength in this ETF. Furthermore, the $EIDO is now poised to break out above the highs of a 7-week base of consolidation. Our trigger price for buy entry is listed on today’s watchlist, but please note that our standard gap rules do NOT apply with the $EIDO trade setup. This means that even if $EIDO opens more than 1.3% above our trigger price, we will still buy on the open (at market).
The only reason we are not using our standard gap rules with this ETF trade setup is because it is an international ETF, and international ETFs tend to accumulate most of their gains in the form of opening gaps. Case in point is iShares Thailand ETF ($THD), which we targeted for buy entry over the course of several days last week, but each time the ETF gapped to open above our trigger price. By the way, if you happened to buy $THD last week (even though we did not), we would continue to hold because the price action looks good.
In addition to $EIDO, another international ETF on our watchlist for potential buy entry today is Guggenheim China real estate ETF ($TAO). On the weekly chart below, notice that $TAO broke out above a 3-month downtrend line last week, after coming to support of its 40-week moving average (approximately equal to the 200 day moving average). Yet, the ETF is still near its 52-week highs:

Zooming in to the shorter term daily chart below, notice that the breakout above the downtrend line occurred in the form of a sharp opening gap last Friday that enabled $TAO to close the day with a 2.8% gain. More importantly, last Friday’s gap put $TAO back above its 50-day moving average:

For the buy setup in $TAO, notice on our watchlist that this is a buy limit order. This means we are looking to buy $TAO on a slight pullback from last Friday’s advance. Specifically, our buy limit order is in undercut of last Friday’s low, which would give us a lower-risk buy entry than buying above last Friday’s high.
The past two weeks have been a mixed bag in terms of price action in leadership stocks. $AIRM, $GEOS, $EBAY, $LPX, $CBI, $TEX, and $OPEN have sold off sharply, while $PRLB, $URI, $GOOG, and $AMZN are still holding on to key support levels.
Our weekend scans revealed many bullish stock patterns. Some charts may need a few more weeks of sideways action, but $LNKD, $SCTY, $SFLY, $ATHN, $SODA, $MGAM, $PFPT, $XONE, $TRLA, $AMBA, $WAGE, $SIRO, and $PERI are a few we are monitoring.
Note the updated target price in $CLDX for 150 shares. We will be selling about 1/3 of the position if it reaches the target, and will hold on to the remaining shares in anticipation of catching a bigger move.
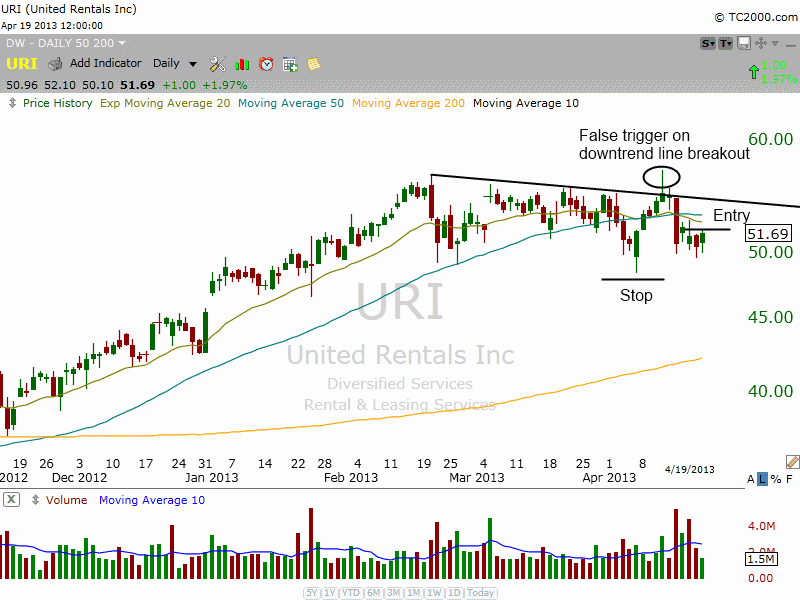
After a false breakout above the downtrend line on April 11, $URI sold off sharply and more than likely ran a ton of sell stops when it knifed through the 50-day MA early last week. By Friday, support held at $50, allowing $URI to close off the lows of the week.
We plan to establish small size on a move above Friday’s high, which should put the price action over the hourly downtrend line of the recent pullback. If $URI is able to reclaim the 50-day MA, we will look to add to the position:

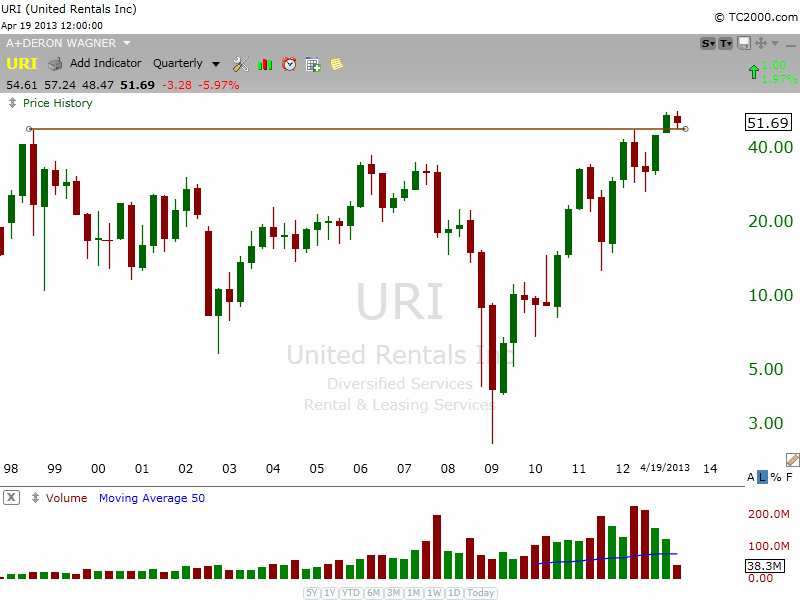
$URI has solid earnings and revenue growth with a respectable relative strength ranking of 86. Looking at the quarterly chart below, the price action has broken out to new all time highs:

relative strength combo watchlist:
Our Relative Strength Combo Watchlist makes it easy for subscribers to import data into their own scanning software, such as Tradestation, Interactive Brokers, and TC2000. This list is comprised of the strongest stocks (technically and fundamentally) in the market over the past six to 12 months. The scan is updated every Sunday, and this week’s RS Combo Watchlist can be downloaded by logging in to the Members Area of our web site.