Current signal generated on close of November 13.
Portfolio exposure can be anywhere from 25% to 50% long. If positions are holding up well, then one can add exposure beyond 50%.
Past signals:
- Neutral signal generated on close of November 6.
- Buy signal generated on close of September 9
- Neutral signal generated on close of August 15
- Buy signal generated on close of July 11
- Neutral signal generated on close of July 5
- Sell signal generated on close of June 24
today’s watchlist (potential trade entries):

Having trouble seeing the open positions graphic above? Click here to view it directly on your web browser instead.
open positions:
Below is an overview of all open positions, as well as a report on all positions that were closed only since the previous day’s newsletter. Changes to open positions since the previous report are listed in pink shaded cells below. Be sure to read the Wagner Daily subscriber guide for important, automatic rules on trade entries and exits.

Having trouble seeing the open positions graphic above? Click here to view it directly on your web browser instead.
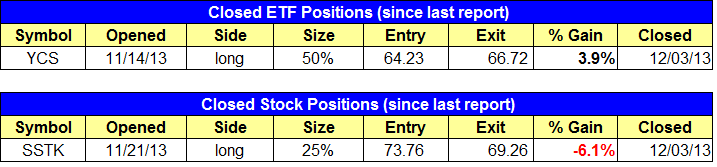
closed positions:
Having trouble seeing the closed positions graphic above? Click here to view it directly on your web browser instead.
ETF position notes:
- $YCS sell stop triggered.
stock position notes:
- $SSTK sell stop triggered.
ETF, stock, and broad market commentary:
Stocks remained in pullback mode on Tuesday, as all major averages closed in negative territory with losses in the -0.2 to -0.6% range. A decent bounce in the final 90 minutes of trading prevented the averages from closing at the lows of the session.
Total volume picked up on the NYSE and NASDAQ. The combination of higher volume and -0.3% loss produced a distribution day in the S&P 500.
However, the distribution was not clear cut, as the bounce off the lows at the end of the session showed that buyers were willing to step in on weakness. If the S&P 500 closed at the lows of the session, then the distribution day would have been more significant.
Despite breaking down below the 10 and 40-week moving averages a few weeks ago, ETFS Physical Palladium Shares ($PALL) is still holding on, and could potentially offer a low risk entry point on a close above the 10 and 40-week MAs, above $71.
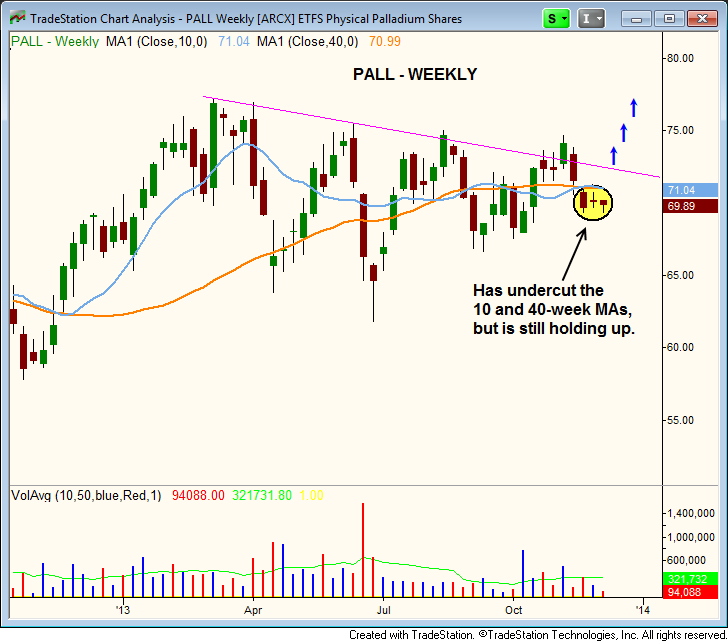
We remain long partial size from a pullback entry just above the 40-week MA in mid-November. If the three week low can hold up, then $PALL will have made another higher swing low within its current base, which is typically a bullish sign.
$PALL could still break down beneath the three week low, so it is best to not jump the gun and wait for a close above $71 before attempting to get long. If $PALL is to stage a significant advance, then it will eventually have to clear prior highs around $74.
Global X FTSE Norway 30 ETF ($NORW) has pulled back to support from the 10-week MA after clearing a significant resistance level around $16.30 in mid-October. The 10-week MA has separated from the 40-week MA and is in a strong uptrend. The 10-week MA is also clearly above the highs of the last base, which is a bullish sign.
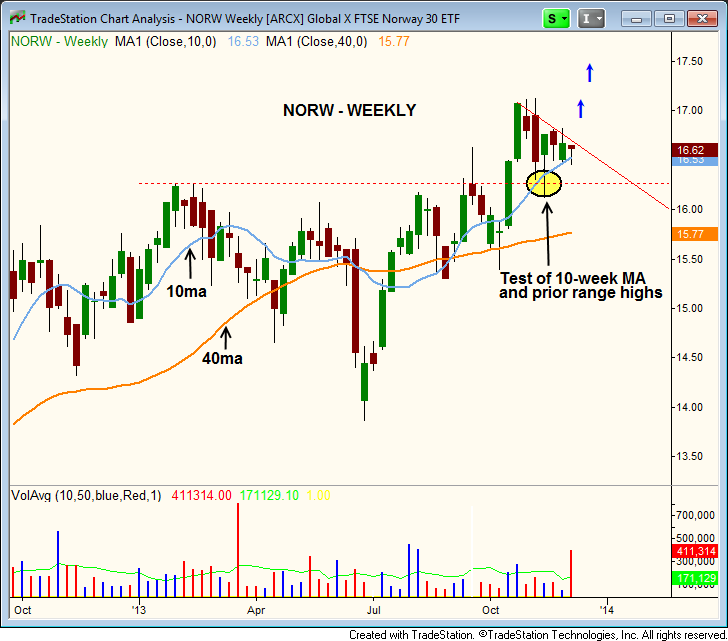
A break above the short-term downtrend line (solid red line) above could spark a resumption of the uptrend, especially if $NORW forms an inside candle this week. An inside week is when a stock/ETF trades within the high and low range of the previous week.
$NORW is currently not listed as an official buy setup, but is an actionable idea over the two-day high for those who are interested in taking the trade on their own. A stop could be placed just below $16.
Yesterday’s only action on the ETF side was in $YCS, which triggered its protective sell stop and we are out with a 4% gain. Please note the changes to the $MLPL setup in the watchlist section above.
On the stock side we were stopped out of our position in $SSTK just before the close. If anyone did not sell $SSTK and are still long, we would continue to hold with a new stop 1 point below today’s low (around 68.26).
The setup still looks okay as the current selloff may just be a typical run on stops. We will continue to monitor the action for a low-risk re-entry point within the next day or two off a bullish reversal candle (if possible).
$FB triggered its buy entry yesterday with a move above last week’s high. We are not expecting the action to rocket higher from here, as we plan to let the base develop and slowly add to the position as higher, low risk entry points emerge.
We made $SSNI an official buy setup in today’s report over last week’s high. Please reference yesterday’s report for chart analysis of $SSNI.
Other stocks we are monitoring are: $LVS $BLMN $INSY $CALD $QIHU $CREG $LNKD $QIWI $ALXN $THRM
Please note the changes to the $KNDI buy setup in the watchlist section above.