market timing model:
Buy – Signal generated on the close of December 31 (click here for more details)
today’s watchlist (potential trade entries):

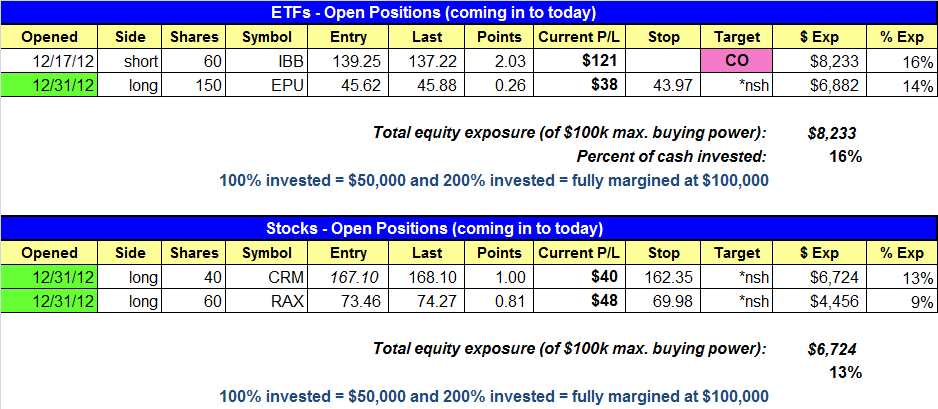
Having trouble seeing the open positions graphic above? Click here to view it directly on your web browser instead.
open positions:
Below is an overview of all open positions, as well as a report on all positions that were closed only since the previous day’s newsletter. Net P/L figures are based on two separate $50,000 model portfolios (one for ETFs and one for stocks). Changes to open positions since the previous report are listed in pink shaded cells below. Be sure to read the Wagner Daily subscriber guide for important, automatic rules on trade entries and exits.
Having trouble seeing the open positions graphic above? Click here to view it directly on your web browser instead.
closed positions:

Having trouble seeing the closed positions graphic above? Click here to view it directly on your web browser instead.
ETF position notes:
- EPU buy setup triggered.
stock position notes:
- CRM and RAX buy setups triggered.
Commentary and charts:
The last day of 2012 proved to be quite powerful, as major averages blasted higher in what was an impressive day of accumulation. Averages closed up more 1.5% across the board with volume increasing on both the NYSE and Nasdaq by 30%. The Nasdaq Composite which had been quite the laggard in December closed out the year with a strong 2.0% advance, and is now back above the 50 and 200-day moving averages.
The combination of Monday’s heavy volume advance and the Nasdaq reclaiming the 50-day MA is enough to put our market timing model back on a buy signal. Although the past two buy signals have failed to impress, our weekend scans produced some of the best chart patterns we have seen in several months. That being said, we shy away from predictions and prefer to take it one day at a time.
$IBB put in a strong reversal candle and closed back above the 50-day MA on Monday. If the market does not continue to strengthen, then we may be able to re-enter $IBB on a bounce but for now we want to prevent a winner from going negative, so we are closing the position on Wednesday’s open.
With the timing model back on a buy signal, we want to continue to build up our long exposure as setups develop. $EPU triggered a buy entry in the ETF portfolio on Monday and we have two new buy setups on today’s watchlist. Both setups are buy limit orders to protect the trades against a potential gap up. If these setups hit the trigger price and your order is not filled, please enter the trade immediately at the market.
The weekly chart of the SPDR S&P Homebuilders ($XHB) shows three months of tight basing action at the highs with a false breakout in early November that led to another nine weeks of consolidation.

Dropping down to the daily chart, we see a tight base trading around the 50-day moving average with two higher lows in early and late December. We are placing $XHB on today’s watchlist. Trade details can be found in the watchlist section above.

On the stock side, We established two new long positions on Monday in $CRM and $RAX. Although $CRM’s share size is light, it is a significant 13% position. We plan to keep share size in the 8-12% area until conditions improve. If our breakouts end up working and market conditions improve we can bump exposure up to the 15-25%.
$REGN is one of three new setups on today’s watchlist. We are looking at a pullback entry off the 50-day MA. $REGN is a leading stock in the biotech sector and may have the best fundamental rankings in its group. The buy entry is over the three-day high:

If you are a new subscriber, please e-mail [email protected] with any questions regarding our trading strategy, money management, or how to make the most out of this report.
relative strength combo watchlist:
Our Relative Strength Combo Watchlist makes it easy for subscribers to import data into their own scanning software, such as Tradestation, Interactive Brokers, and TC2000. This list is comprised of the strongest stocks (technically and fundamentally) in the market over the past six to 12 months. The scan is updated every Sunday, and this week’s RS Combo Watchlist can be downloaded by logging in to the Members Area of our web site.