market timing model:
Buy – Signal generated on the close of December 18 (click here for more details)
today’s watchlist (potential trade entries):

Having trouble seeing the open positions graphic above? Click here to view it directly on your web browser instead.
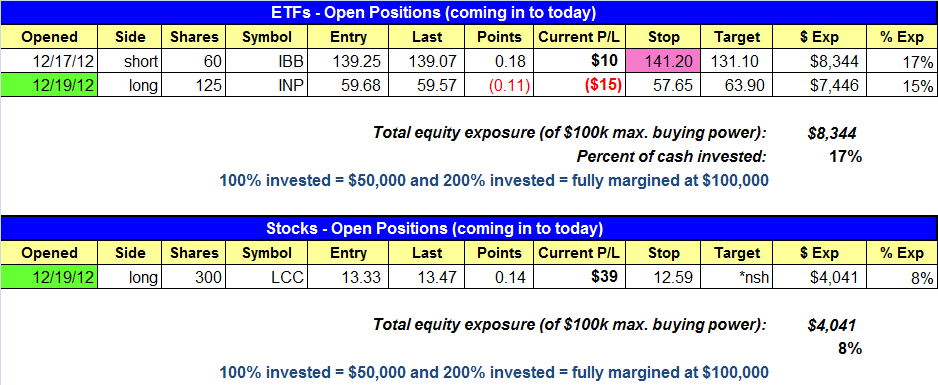
open positions:
Below is an overview of all open positions, as well as a report on all positions that were closed only since the previous day’s newsletter. Net P/L figures are based on two separate $50,000 model portfolios (one for ETFs and one for stocks). Changes to open positions since the previous report are listed in pink shaded cells below. Be sure to read the Wagner Daily subscriber guide for important, automatic rules on trade entries and exits.
Having trouble seeing the open positions graphic above? Click here to view it directly on your web browser instead.
closed positions:
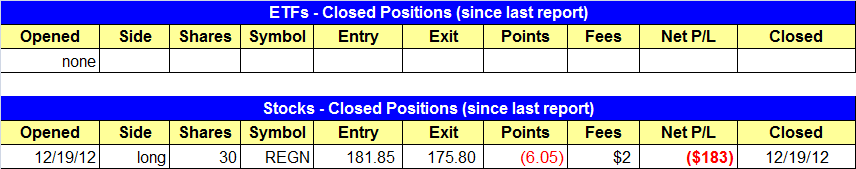
Having trouble seeing the closed positions graphic above? Click here to view it directly on your web browser instead.
ETF position notes:
- $INP buy setup triggered and we are long.
stock position notes:
- $LCC buy stop triggered and we are long.
- $REGN buy stop triggered but unfortunately stopped us out later in the morning. $REGN basically false triggered on the open, as it never really actively traded above our buy pivot. This happens from time to time, and they only way to avoid it is to not trade the first five minutes after the open. Certain brokers will allow you to set buy stop orders to only go live at a certain time.
ETF and broad market commentary:
After two solid days of gains in the broad market, the major indices pulled back on lighter volume yesterday. A sell-off in the final 90 minutes of trading caused the S&P 500 and Dow Jones Industrial Average to slide an average of 0.75%. However, the tech-heavy Nasdaq slipped just 0.3%. Given that most of the broad-based indexes jumped more than 2% over the preceding two days, yesterday’s decline was relatively minor. Furthermore, total volume in both the NYSE and Nasdaq was an average of 6% lighter than the previous day’s levels. This tells us the bulls were merely taking a rest, rather than selling into strength of the recent rally.
On the close of trading on December 18, our model for timing the stock market shifted from “neutral” to “buy” mode. This was based on the major indices breaking out above their 3-month downtrend lines, the lack of “distribution day” in the broad market, and the back to back “accumulation days” that were indicative of institutional buying.
Global X InterBolsa FTSE Colombia20 ($GXG) has been consolidating on the weekly chart since last May, forming a cup and handle type pattern, with the handle forming from late October through December. A break above the blue downtrend line could ignite the next wave of buying.

On the daily chart, $GXG is potentially forming a shorter-term cup and handle pattern within the larger cup and handle pattern on the weekly chart. This is bullish price action that may need a few more weeks to properly develop. A little pullback or shakeout action in the handle is a positive sign. Ideally, we would like to see $GXG pullback to the 20-day EMA around 21.80 over the next 5-10 days. Although the setup is not actionable right now it is on our internal watchlist.

There are no new setups for today. For now, it’s quite possible that the main stock market indexes may have run their course for at least the rest of the year. If that is the case, we will lie low with regard to entering new trade entries. But until we see significant reason to believe market participants have actually started dumping as well, we will continue trading in the dominant direction of the near to intermediate-term trend, even if our objective, technical market timing bias frequently changes.
stock commentary:
$REGN’s price action was certainly disappointing. We do not mind losing trades when there is a legit trigger because losing is part of this business. However, when we see gap ‘n trap price action like we did in $REGN yesterday, it is certainly tough to take, especially when there should not have been a trigger. For all intraday guys, please remember to use the 5-minute rule before purchasing stocks on the open. The 5-minute rule is: If a stock/ETF triggers within the first 5-minute of trading ignore the trigger and do nothing. After 5-minutes (at 9:35) mark the 5-minute high and place a new buy stop slightly above the 5-minute high provided that it isn’t too extended from the original buy point (1.3% to 1.5% above the original buy point is a good cutoff in general). For those new to our letter or our style of trading, please avoid any pre-market buying and wait for the market to open before purchasing an ETF or stock.
$LCC broke out and closed up 4.0% on higher than average volume. $CPA and $ALGT are stocks within the group that are also strong, so we do have industry group confirmation.
The way we trade stocks is very simple. If the market is healthy and there are bullish patterns with legit entry points….we buy! If the market is healthy but we are unable to locate bullish patterns we do nothing and wait for setups to improve. The beauty is in the simplicity. If our new buys work out well, then we buy more stock and increase size. If they don’t, we back off and wait for new setups or for conditions to improve. By doing it this way we avoid having an opinion or trying to predict price action, we simply go with the flow.
If you are a new subscriber, please e-mail [email protected] with any questions regarding our trading strategy, money management, or how to make the most out of this report.
relative strength combo watchlist:
Our Relative Strength Combo Watchlist makes it easy for subscribers to import data into their own scanning software, such as Tradestation, Interactive Brokers, and TC2000. This list is comprised of the strongest stocks (technically and fundamentally) in the market over the past six to 12 months. The scan is updated every Sunday, and this week’s RS Combo Watchlist can be downloaded by logging in to the Members Area of our web site.